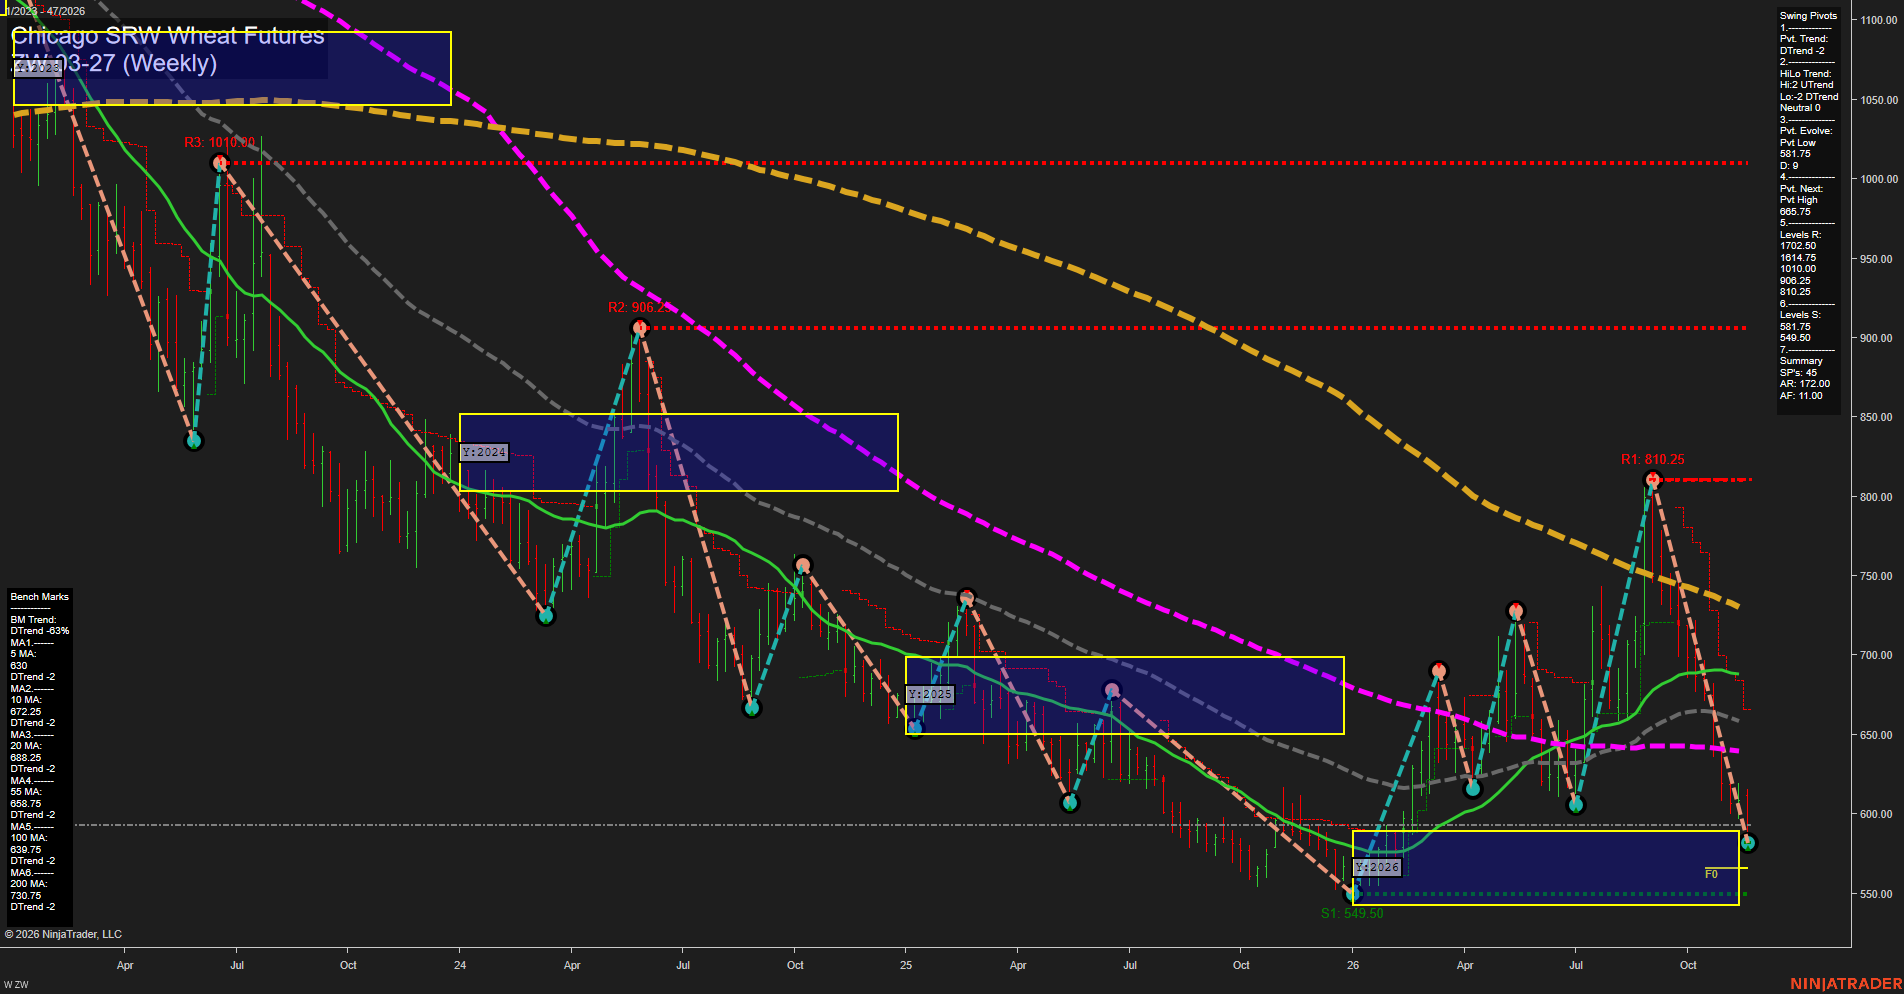
ZW Chicago SRW Wheat Futures Weekly Chart Analysis — Pre-Open: 2026-Nov-21 07:16 CT
Price Action
- Last: Approximately 593,
- Bars: Large,
- Mom: Momentum fast.
WSFG Weekly
- Near-Term
- WSFG Current: -72%
- F0%/NTZ' Bias: Price Below,
- WSFG Trend: Down.
MSFG Month Nov
- Medium-Term
- MSFG Current: -22%
- F0%/NTZ' Bias: Price Below,
- MSFG Trend: Down.
YSFG Year 2026
- Far-Term
- YSFG Current: 11%
- F0%/NTZ' Bias: Price Above,
- YSFG Trend: Up.
Swing Pivots
- (Near-Term) 1. Pvt. Trend: DTrend,
- (Medium-Term) 2. HiLo Trend: Neutral,
- 3. Pvt. Evolve: Pvt low 581.75,
- 4. Pvt. Next: Pvt high 665.75,
- 5. Levels R: 1702.50, 1614.75, 1010.00, 906.25, 810.25,
- 6. Levels S: 581.75, 549.50.
Weekly Benchmarks
- (Near-Term) 5 Week: 630.00 Down Trend,
- (Near-Term) 10 Week: 672.25 Down Trend,
- (Medium-Term) 20 Week: 688.25 Down Trend,
- (Medium-Term) 55 Week: 658.75 Down Trend,
- (Far-Term) 100 Week: 639.75 Down Trend,
- (Far-Term) 200 Week: 730.75 Down Trend.
Recent Trade Signals
- 20 Nov 2026: Short ZW 03-27 @ 593 Signals.USAR-MSFG
- 13 Nov 2026: Long ZW 12-26 @ 597 Signals.USAR-WSFG
Overall Rating
- Near-Term: Bearish,
- Medium-Term: Bearish,
- Far-Term: Bearish.
Key Insights Summary
The weekly swing structure shows a sharp selloff from 810.25 into an evolving pivot low at 581.75, with large bars reflecting fast downside momentum. Price is below all six declining benchmarks, reinforcing bearish near- and medium-term conditions. The HiLo summary is neutral, combining rising swing highs with falling swing lows rather than a clean directional sequence. Support is concentrated at 581.75 and 549.50; the next opposite-pivot threshold is 665.75. The positive yearly grid is the principal counterpoint to otherwise bearish technical alignment, although price has returned to the upper boundary of the yearly neutral zone. The latest monthly short signal contrasts with the preceding weekly long signal; these reference different contract months and do not establish a same-contract reversal. No TR120 or TR720 signals are supplied. Overall, the chart depicts a failed rally and renewed downside pressure within a broad, volatile range; news and seasonal drivers cannot be established from the chart alone.
Chart Analysis ATS AI Generated: 2026-11-21 07:16 for Informational use only, not trading advice. Terms and Risk Disclosure Copyright © 2026. Algo Trading Systems LLC.