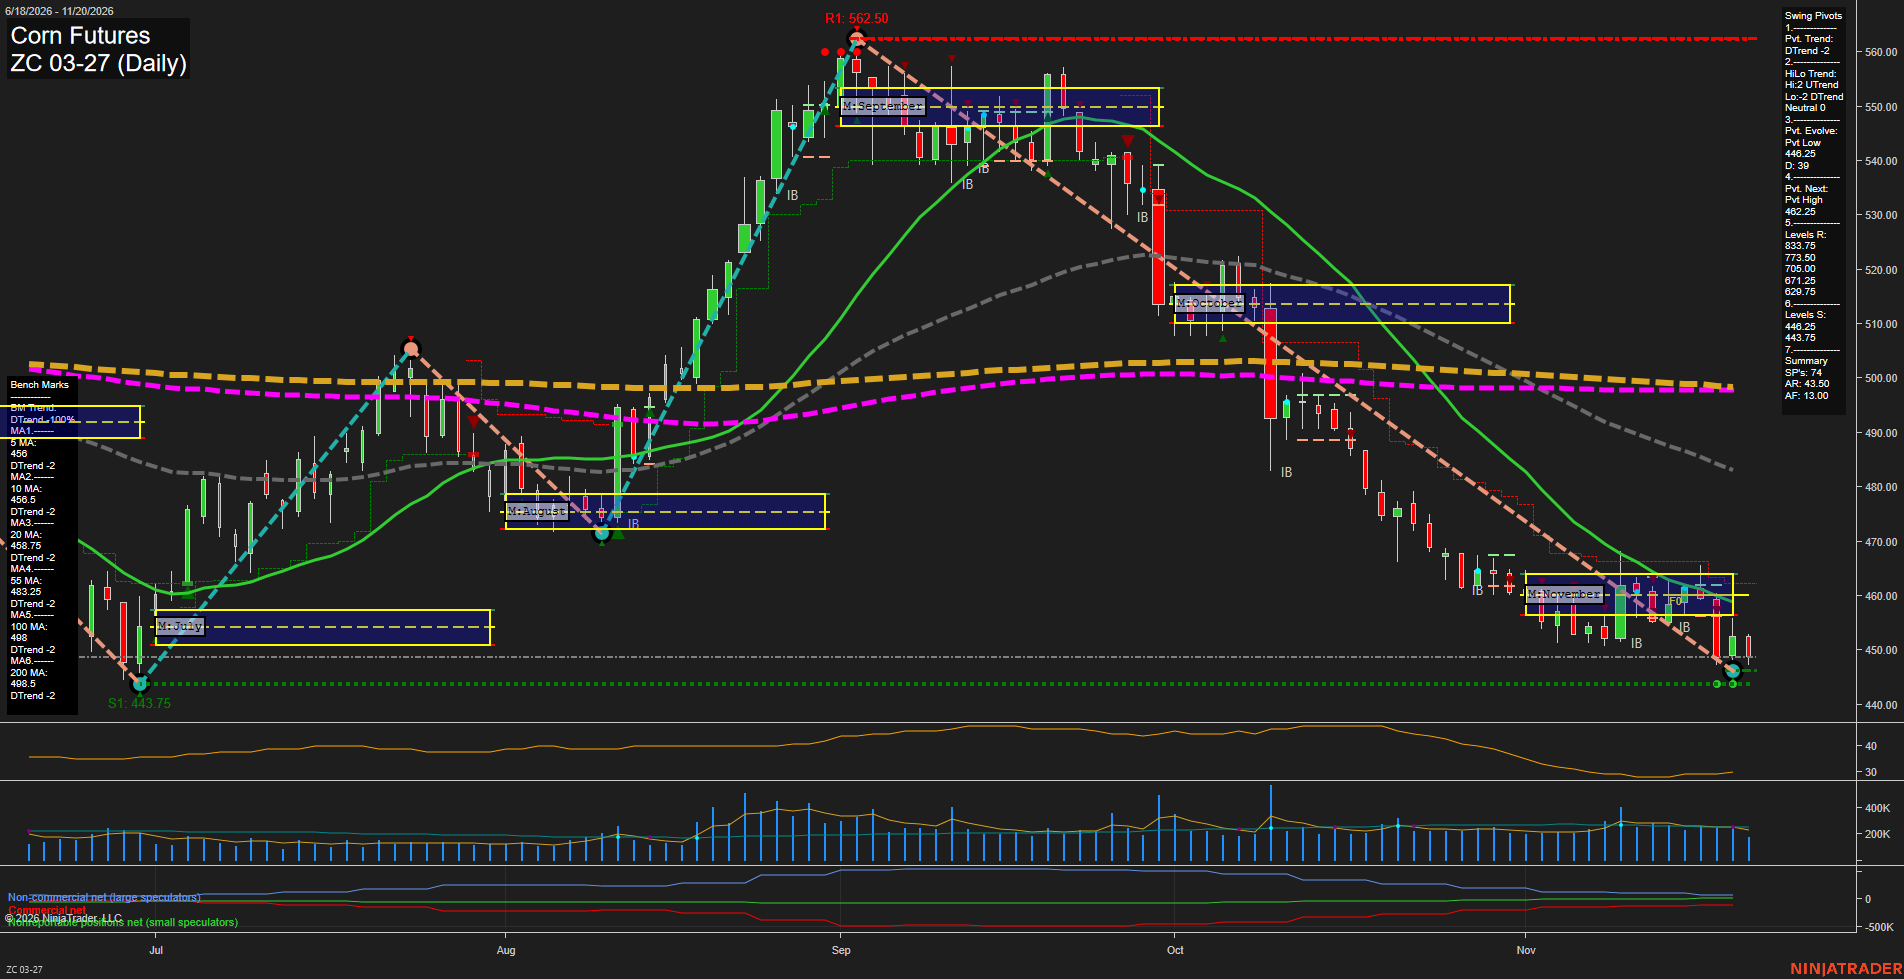
ZC Corn Futures Daily Chart Analysis — Pre-Open: 2026-Nov-21 07:15 CT
Price Action
- Last: Approximately 449,
- Bars: Small,
- Mom: Momentum slow.
WSFG Weekly
- Near-Term
- WSFG Current: -76%
- F0%/NTZ' Bias: Price Below,
- WSFG Trend: Down.
MSFG Month Nov
- Medium-Term
- MSFG Current: -20%
- F0%/NTZ' Bias: Price Below,
- MSFG Trend: Down.
YSFG Year 2026
- Far-Term
- YSFG Current: -45%
- F0%/NTZ' Bias: Price Below,
- YSFG Trend: Down.
Swing Pivots
- (Near-Term) 1. Pvt. Trend: DTrend,
- (Medium-Term) 2. HiLo Trend: Neutral,
- 3. Pvt. Evolve: Pvt low 446.25,
- 4. Pvt. Next: Pvt high 462.25,
- 5. Levels R: 833.75, 773.50, 705.00, 671.25, 629.75,
- 6. Levels S: 446.25, 443.75.
Daily Benchmarks
- (Near-Term) 5 Day: 456 Down Trend,
- (Near-Term) 10 Day: 456.5 Down Trend,
- (Medium-Term) 20 Day: 458.75 Down Trend,
- (Medium-Term) 55 Day: 483.25 Down Trend,
- (Far-Term) 100 Day: 498 Down Trend,
- (Far-Term) 200 Day: 498.5 Down Trend.
Additional Metrics
Recent Trade Signals
- 20 Nov 2026: Short ZC 03-27 @ 451.5 Signals.USAR-MSFG
- 16 Nov 2026: Long ZC 12-26 @ 448.5 Signals.USAR-WSFG
Overall Rating
- Near-Term: Bearish,
- Medium-Term: Bearish,
- Far-Term: Bearish.
Key Insights Summary
From a futures swing perspective, the September peak at 562.50 has developed into a sustained decline, with November consolidation resolving below the monthly NTZ. Price remains below every benchmark, and all six averages are declining, reinforcing bearish alignment across time horizons. Smaller recent candles and lower ATR than earlier in the decline indicate slowing momentum rather than a confirmed reversal. The evolving pivot low at 446.25 sits just above July support at 443.75, making this a significant historical support test. The next opposite-pivot threshold is 462.25; the visible September swing high is 562.50, distinct from the distant resistance levels listed in the summary. The HiLo summary is neutral because its high and low components disagree, despite the near-term pivot downtrend. The latest monthly short signal contrasts with the earlier weekly long signal, but those signals reference different delivery contracts. No news catalyst or seasonal conclusion can be established from this chart alone.
Chart Analysis ATS AI Generated: 2026-11-21 07:15 for Informational use only, not trading advice. Terms and Risk Disclosure Copyright © 2026. Algo Trading Systems LLC.