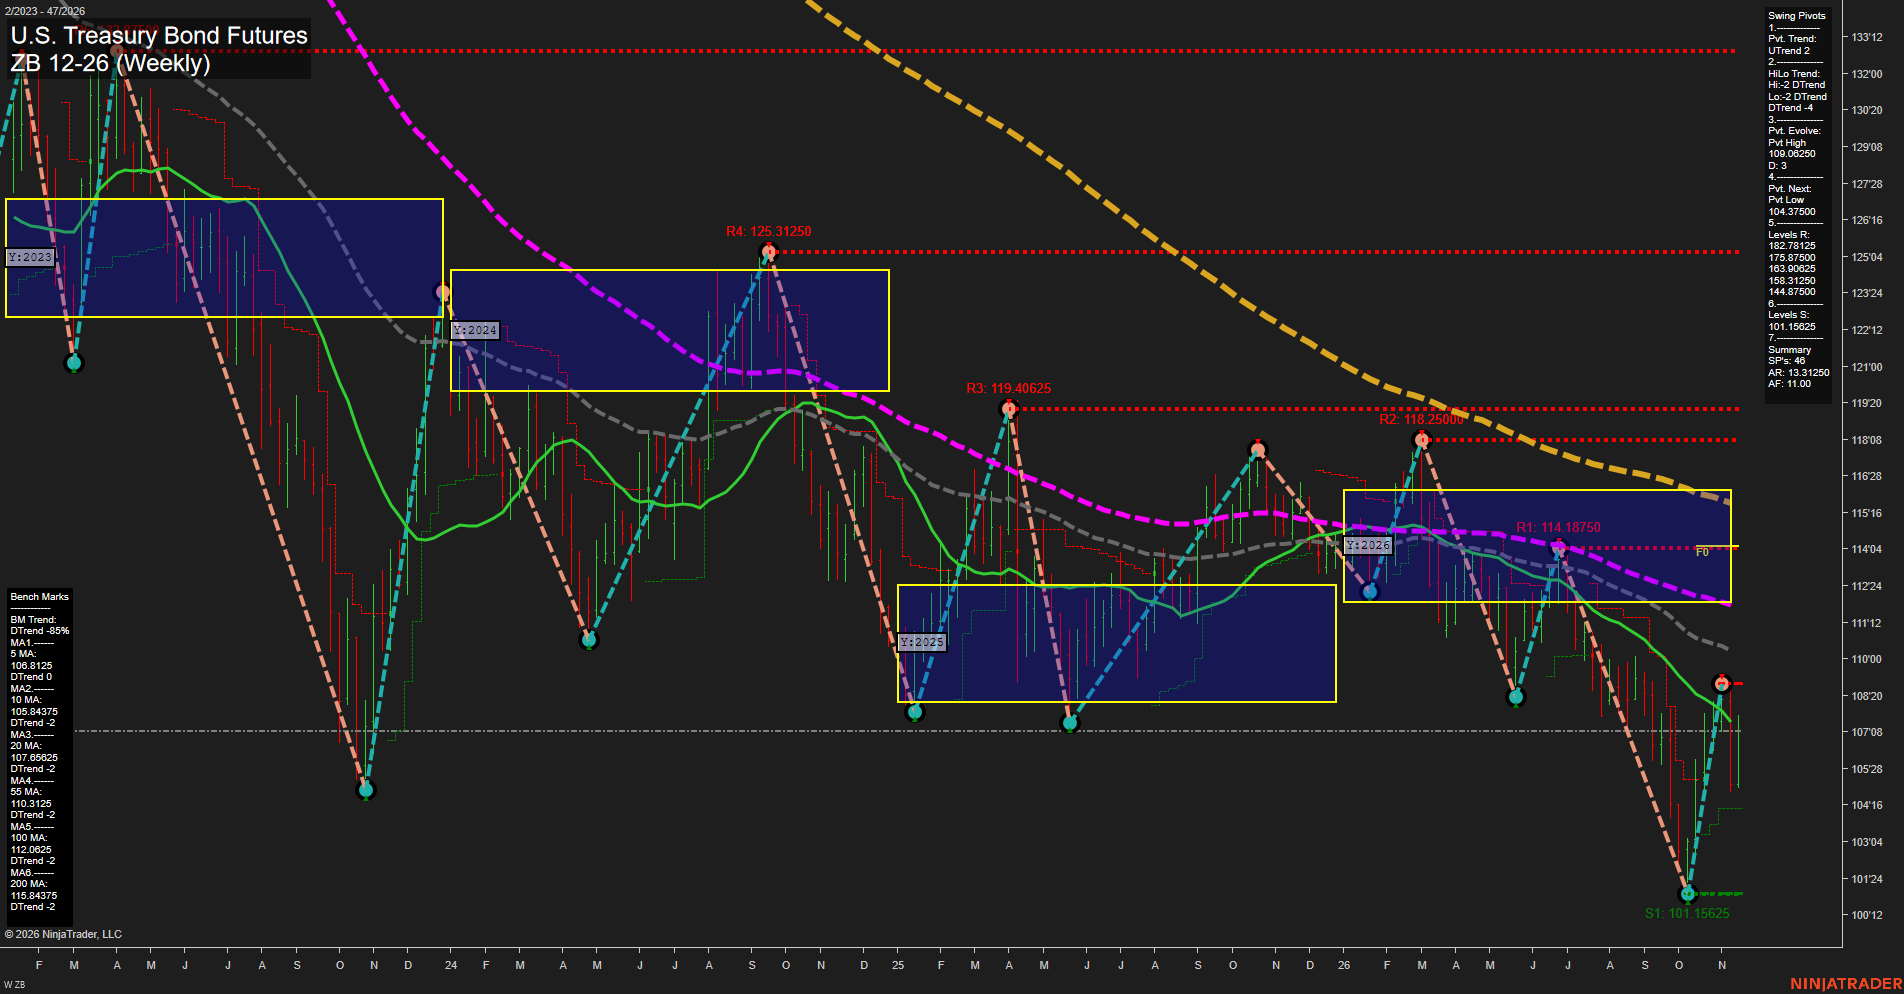
ZB U.S. Treasury Bond Futures Weekly Chart Analysis — Pre-Open: 2026-Nov-21 07:15 CT
Price Action
- Last: Approximately 107.25,
- Bars: Large,
- Mom: Momentum fast.
WSFG Weekly
- Near-Term
- WSFG Current: 79%
- F0%/NTZ' Bias: Price Above,
- WSFG Trend: Up.
MSFG Month Nov
- Medium-Term
- MSFG Current: -7%
- F0%/NTZ' Bias: Price Below,
- MSFG Trend: Down.
YSFG Year 2026
- Far-Term
- YSFG Current: -33%
- F0%/NTZ' Bias: Price Below,
- YSFG Trend: Down.
Swing Pivots
- (Near-Term) 1. Pvt. Trend: UTrend,
- (Medium-Term) 2. HiLo Trend: DTrend,
- 3. Pvt. Evolve: Pvt high 109.06250,
- 4. Pvt. Next: Pvt low 104.37500,
- 5. Levels R: 182.78125, 175.87500, 163.90625, 158.31250, 144.87500,
- 6. Levels S: 101.15625.
Weekly Benchmarks
- (Near-Term) 5 Week: 106.8125 Down Trend,
- (Near-Term) 10 Week: 105.84375 Down Trend,
- (Medium-Term) 20 Week: 107.65625 Down Trend,
- (Medium-Term) 55 Week: 110.3125 Down Trend,
- (Far-Term) 100 Week: 112.0625 Down Trend,
- (Far-Term) 200 Week: 115.84375 Down Trend.
Overall Rating
- Near-Term: Bullish,
- Medium-Term: Bearish,
- Far-Term: Bearish.
Key Insights Summary
The swing-trading picture is a sharp countertrend rebound within a persistent broader downtrend. Price has recovered from 101.15625 and stands above the falling 5- and 10-week benchmarks, supporting the weekly grid and upward near-term pivot trend. However, the developing 109.06250 pivot high has been followed by a pullback, and price remains below the 20-, 55-, 100- and 200-week benchmarks. Lower medium-term pivot highs and lows, together with negative monthly and yearly grids, leave the broader bearish structure intact. The summary resistance values reported above lie outside the displayed price range; visible chart resistance is 114.18750, 118.25000, 119.40625 and 125.31250. The 104.37500 next-pivot threshold and 101.15625 swing low define important structural reference points. Recent named trade signals are not legible, so the near-term bullish rating reflects the weekly grid and pivot direction rather than confirmed signal agreement. News and seasonal effects cannot be established from this chart alone.
Chart Analysis ATS AI Generated: 2026-11-21 07:15 for Informational use only, not trading advice. Terms and Risk Disclosure Copyright © 2026. Algo Trading Systems LLC.