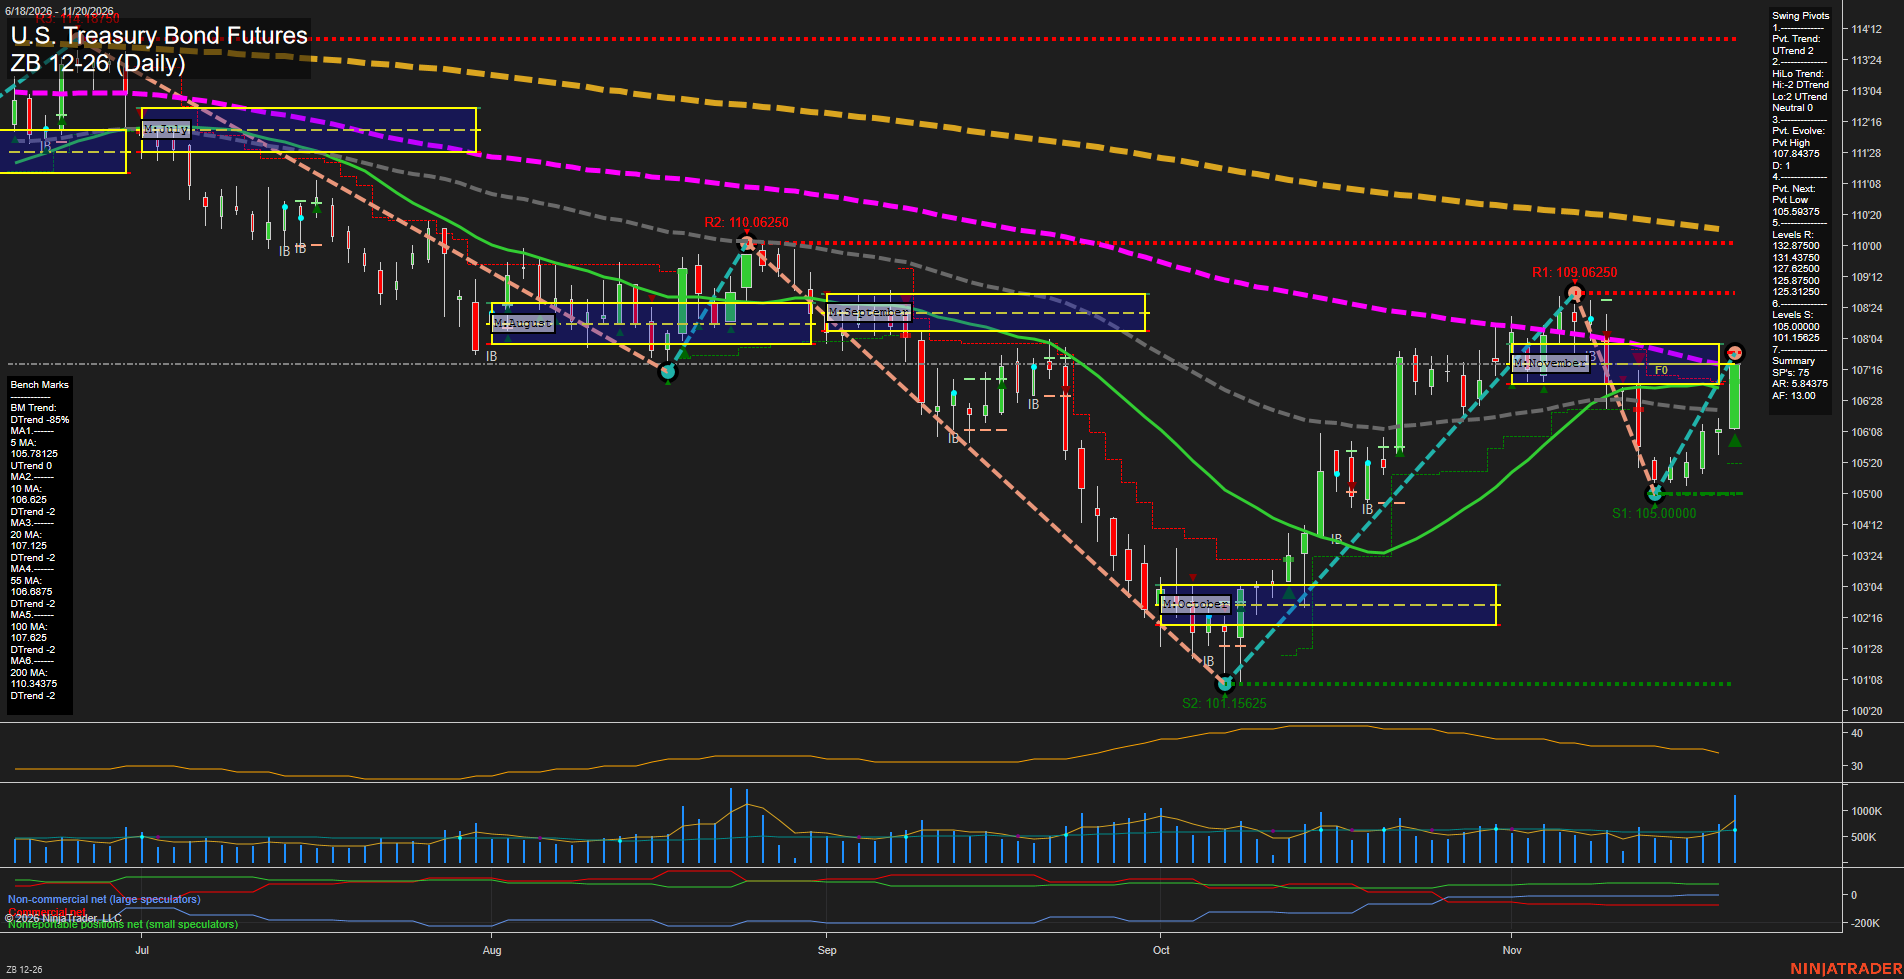
ZB U.S. Treasury Bond Futures Daily Chart Analysis — Pre-Open: 2026-Nov-21 07:15 CT
Price Action
- Last: Approximately 107.84375,
- Bars: Large,
- Mom: Momentum fast.
WSFG Weekly
- Near-Term
- WSFG Current: 79%
- F0%/NTZ' Bias: Price Above,
- WSFG Trend: Up.
MSFG Month Nov
- Medium-Term
- MSFG Current: -7%
- F0%/NTZ' Bias: Price Below,
- MSFG Trend: Down.
YSFG Year 2026
- Far-Term
- YSFG Current: -33%
- F0%/NTZ' Bias: Price Below,
- YSFG Trend: Down.
Swing Pivots
- (Near-Term) 1. Pvt. Trend: UTrend,
- (Medium-Term) 2. HiLo Trend: Neutral,
- 3. Pvt. Evolve: Pvt high 107.84375,
- 4. Pvt. Next: Pvt low 105.59375,
- 5. Levels R: 132.87500, 131.43750, 127.62500, 125.87500, 125.31250,
- 6. Levels S: 105.00000, 101.15625.
Daily Benchmarks
- (Near-Term) 5 Day: 105.78125 Up Trend,
- (Near-Term) 10 Day: 106.625 Down Trend,
- (Medium-Term) 20 Day: 107.125 Down Trend,
- (Medium-Term) 55 Day: 106.6875 Down Trend,
- (Far-Term) 100 Day: 107.625 Down Trend,
- (Far-Term) 200 Day: 110.34375 Down Trend.
Additional Metrics
Overall Rating
- Near-Term: Bullish,
- Medium-Term: Bearish,
- Far-Term: Bearish.
Key Insights Summary
The near-term swing has turned upward from 105.00000, producing a large bullish daily bar and reclaiming the benchmark averages through the 100-day. Weekly grid strength and the rising evolving pivot support the bullish near-term assessment, although only the 5-day benchmark has turned upward. The broader structure remains a countertrend recovery within declining medium- and far-term benchmarks. Mixed pivot structure—lower highs but higher lows—indicates consolidation rather than an established medium-term uptrend. The latest recovery is testing the November grid’s upper region and the declining 100-day average; plotted resistance stands at 109.06250 and 110.06250. The resistance values printed in the Swing Pivots summary, reproduced above, conflict with those plotted levels. Likewise, the supplied monthly grid reading is bearish, while the latest visible bar reaches the upper part of its box. Recent volume expands with the rebound, while ATR has eased from its October peak. The named USAR signal readings are not visible, and the image does not establish a news or seasonal catalyst.
Chart Analysis ATS AI Generated: 2026-11-21 07:15 for Informational use only, not trading advice. Terms and Risk Disclosure Copyright © 2026. Algo Trading Systems LLC.