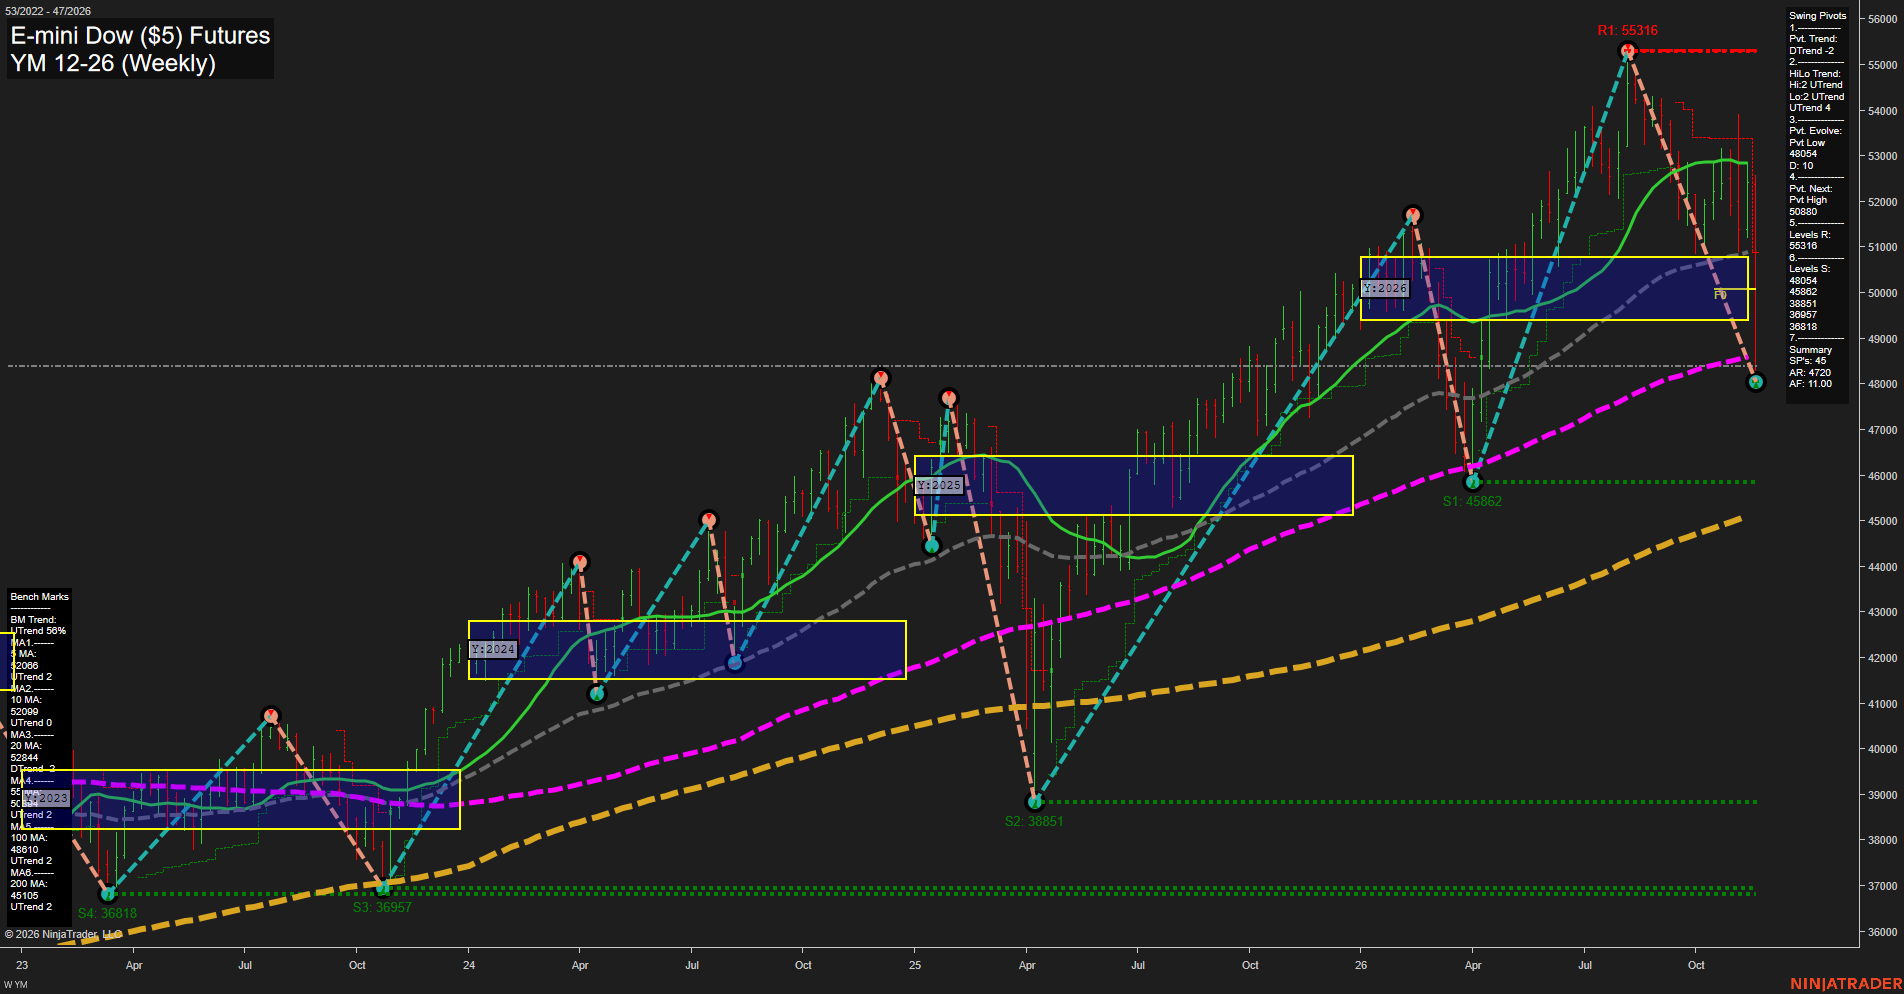
YM E-mini Dow ($5) Futures Weekly Chart Analysis — Pre-Open: 2026-Nov-21 07:15 CT
Price Action
- Last: Approximately 48400,
- Bars: Large,
- Mom: Momentum fast.
WSFG Weekly
- Near-Term
- WSFG Current: -226%
- F0%/NTZ' Bias: Price Below,
- WSFG Trend: Down.
MSFG Month Nov
- Medium-Term
- MSFG Current: -162%
- F0%/NTZ' Bias: Price Below,
- MSFG Trend: Down.
YSFG Year 2026
- Far-Term
- YSFG Current: -25%
- F0%/NTZ' Bias: Price Below,
- YSFG Trend: Down.
Swing Pivots
- (Near-Term) 1. Pvt. Trend: DTrend,
- (Medium-Term) 2. HiLo Trend: UTrend,
- 3. Pvt. Evolve: Pvt low 48054,
- 4. Pvt. Next: Pvt high 50880,
- 5. Levels R: 55316,
- 6. Levels S: 48054, 45862, 38851, 36957, 36818.
Weekly Benchmarks
- (Near-Term) 5 Week: Approximately 52066 Up Trend,
- (Near-Term) 10 Week: 52099 Up Trend,
- (Medium-Term) 20 Week: 52844 Down Trend,
- (Medium-Term) 55 Week: Approximately 50800 Up Trend,
- (Far-Term) 100 Week: 48610 Up Trend,
- (Far-Term) 200 Week: 45105 Up Trend.
Recent Trade Signals
- 16 Nov 2026: Short YM 12-26 @ 51715 Signals.USAR-MSFG
- 16 Nov 2026: Short YM 12-26 @ 52148 Signals.USAR.TR120
- 16 Nov 2026: Short YM 12-26 @ 52178 Signals.USAR-WSFG
Overall Rating
- Near-Term: Bearish,
- Medium-Term: Bearish,
- Far-Term: Bullish.
Key Insights Summary
The weekly chart shows a sharp downswing from 55316 to an evolving low of 48054, with large bars indicating forceful downside momentum. Near-term pivot direction, both shorter session grids, and the supplied short signals align bearishly. Medium-term conditions have weakened as price has fallen below the 20- and 55-week benchmarks and the yearly neutral zone, although the higher-high/higher-low pivot structure remains intact. Price is also marginally below the rising 100-week average, making this a substantial correction within a still-rising long-term benchmark structure rather than a confirmed major-trend reversal. The 48054 evolving low and prior 45862 swing low define successive support references; 50880 is the summary's opposite-pivot reversal threshold. Rising 100- and 200-week averages underpin the bullish far-term rating, but the negative yearly grid highlights deterioration. No TR720 signal or verified news catalyst is supplied, and seasonal tendencies alone do not explain the decline.
Chart Analysis ATS AI Generated: 2026-11-21 07:15 for Informational use only, not trading advice. Terms and Risk Disclosure Copyright © 2026. Algo Trading Systems LLC.