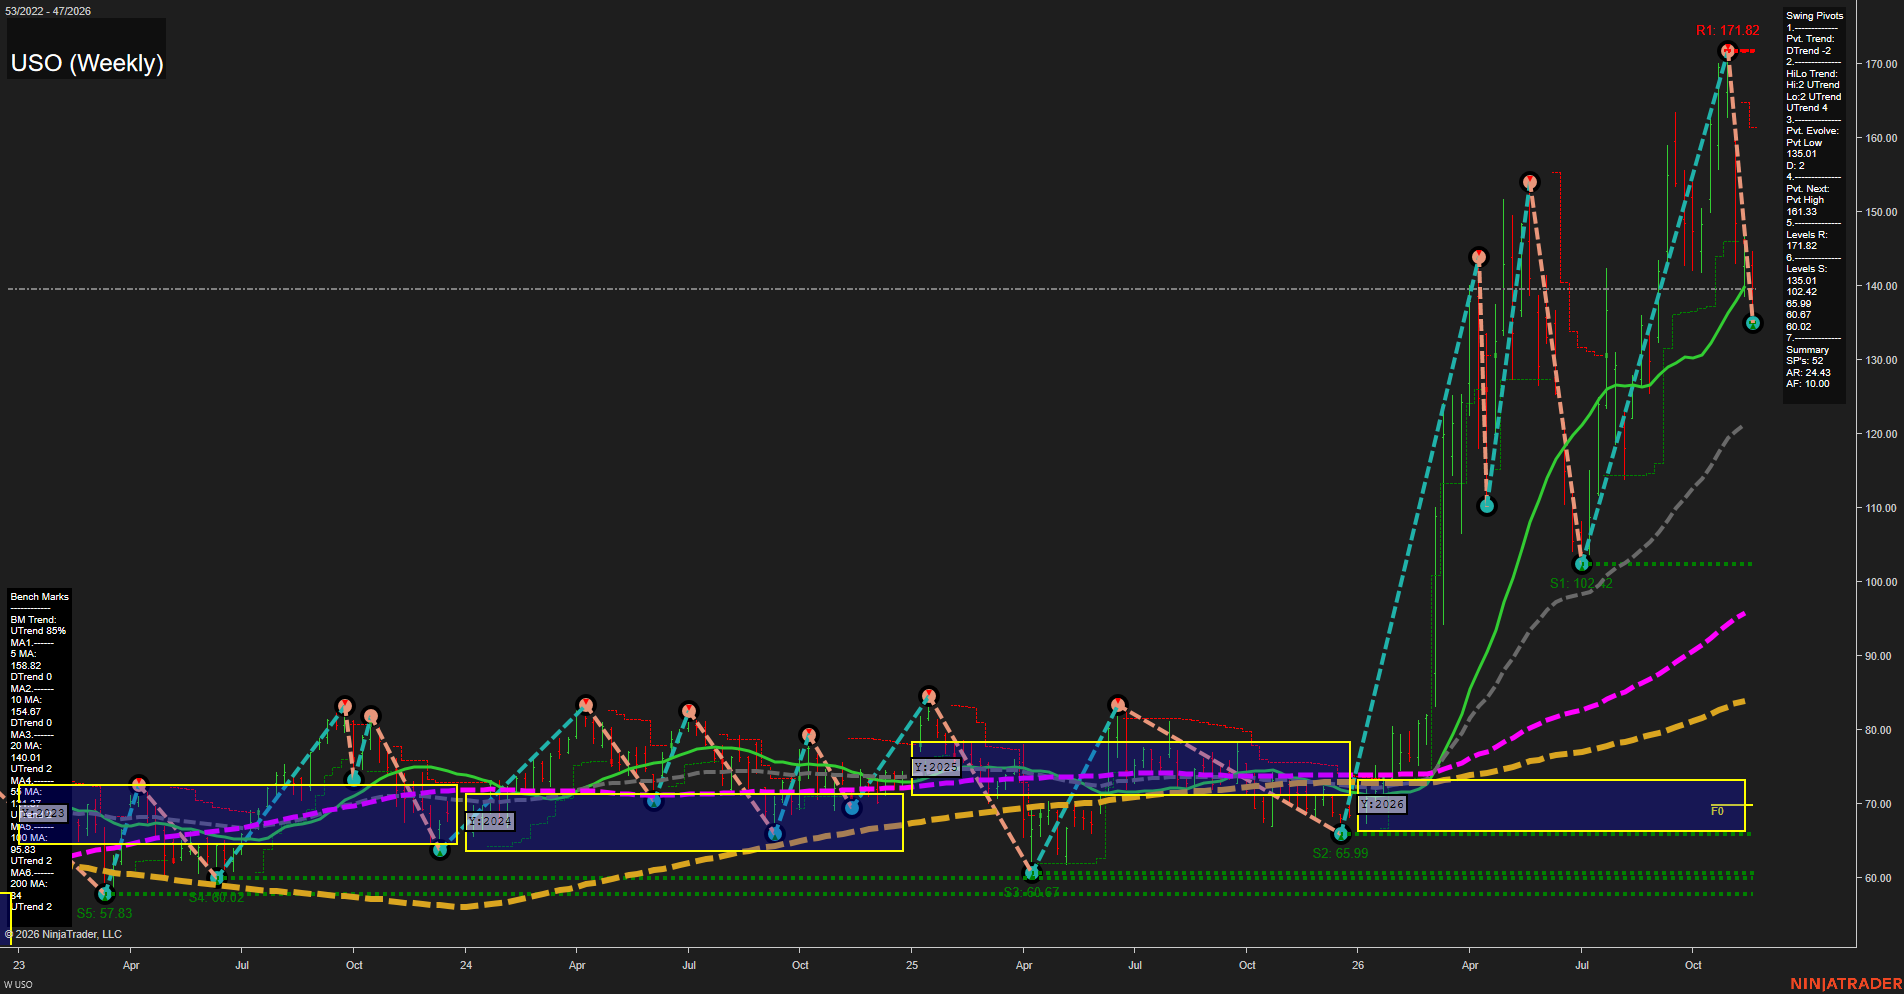
From a futures swing trader’s perspective, this is a sharp countertrend downswing within a broader rising structure. The decline from 171.82 to the evolving 135.01 pivot low represents approximately 21%, highlighting substantial weekly volatility. Price is below the declining 5- and 10-week benchmarks and marginally below the rising 20-week benchmark, confirming near-term deterioration. However, the medium-term higher-high/higher-low pivot structure remains upward, with price above the rising 55-, 100- and 200-week benchmarks. The 135.01 evolving low and 102.42 prior swing low define successive support references; 161.33 is the stated opposite-pivot reversal threshold, while 171.82 remains overhead resistance. Weekly and monthly grids and the requested recent signal studies are not visible, so their direction cannot be verified. The grid fields above retain the prescribed neutral placeholders; the visible yearly grid actually places price well above its approximately 66–73 neutral zone, supporting a bullish far-term interpretation. No news or seasonal catalyst can be established from this chart. USO is an oil-futures-linked fund rather than a futures contract, so these price levels are specific to USO.