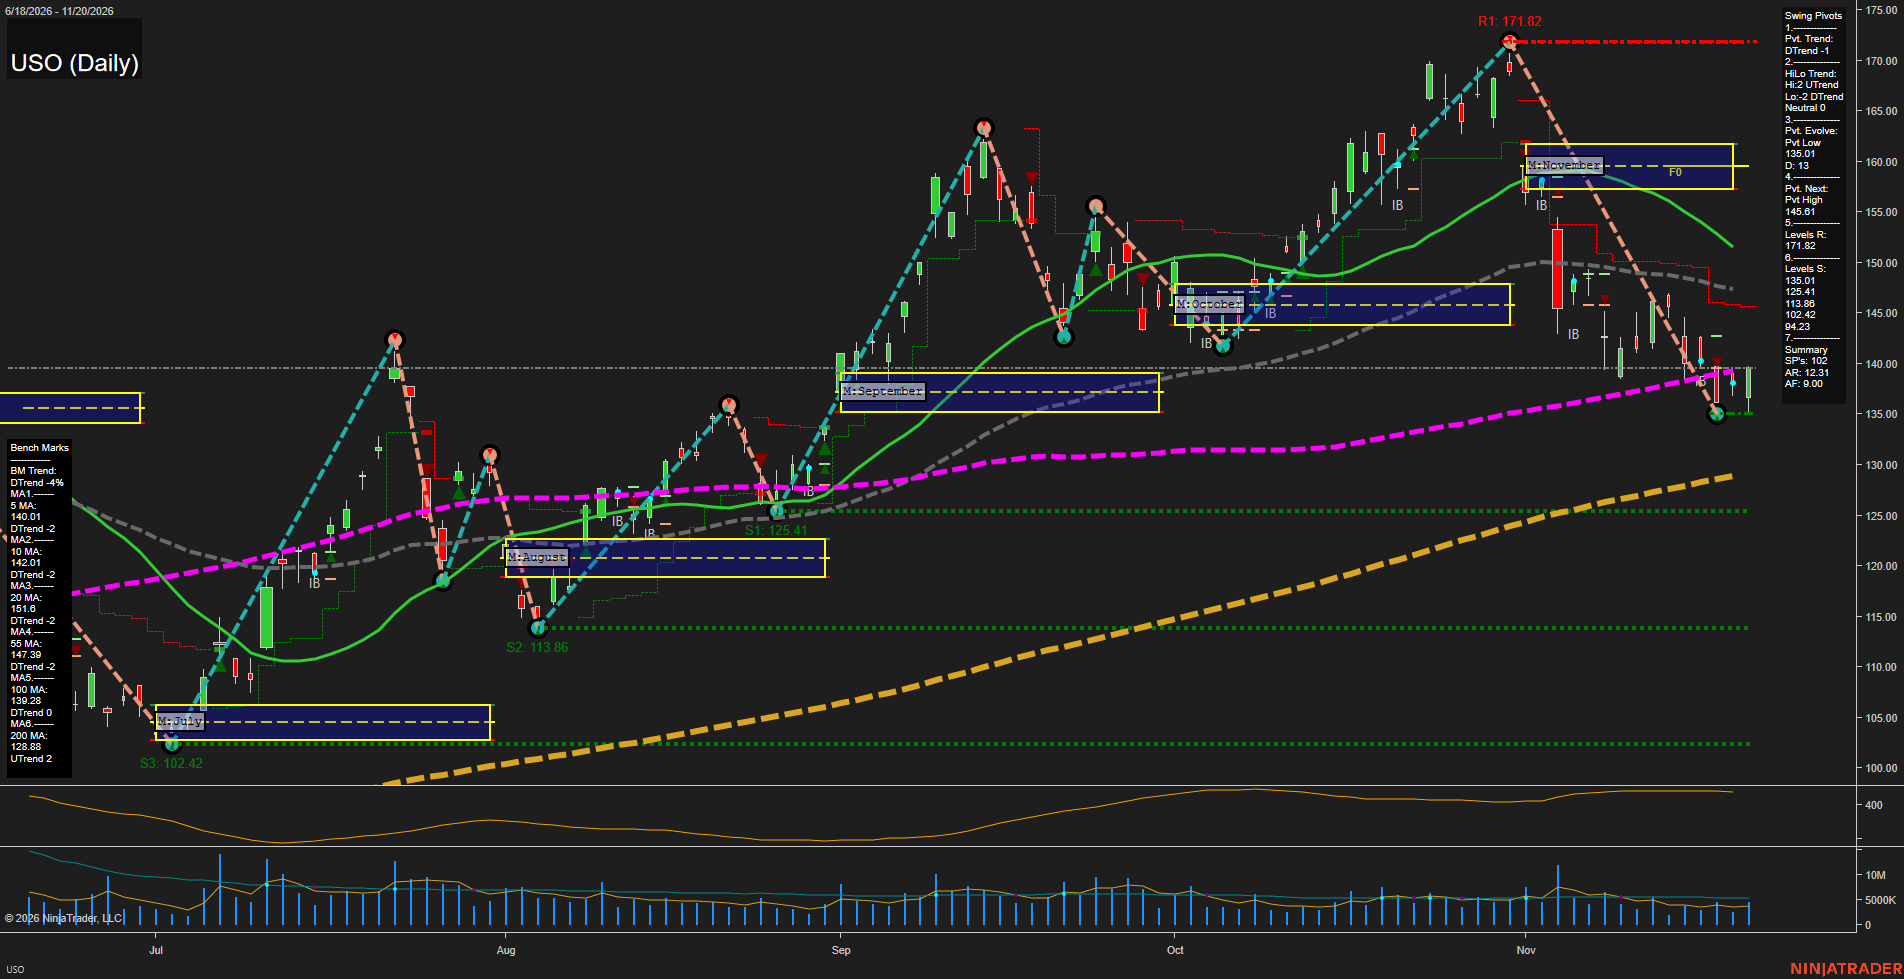
USO United States Oil Fund LP Daily Chart Analysis — Pre-Open: 2026-Nov-21 07:14 CT
Price Action
- Last: approximately 139.60,
- Bars: Medium,
- Mom: Momentum slow.
WSFG Weekly
- Near-Term
- WSFG Current: NA%
- F0%/NTZ' Bias: Price Neutral,
- WSFG Trend: Neutral.
MSFG Month Nov
- Medium-Term
- MSFG Current: NA%
- F0%/NTZ' Bias: Price Below NTZ,
- MSFG Trend: Bearish.
YSFG Year 2026
- Far-Term
- YSFG Current: NA%
- F0%/NTZ' Bias: Price Neutral,
- YSFG Trend: Neutral.
Swing Pivots
- (Near-Term) 1. Pvt. Trend: DTrend,
- (Medium-Term) 2. HiLo Trend: Neutral,
- 3. Pvt. Evolve: Pvt low 135.01,
- 4. Pvt. Next: Pvt high 145.61,
- 5. Levels R: 171.82,
- 6. Levels S: 135.01, 125.41, 113.86, 102.42, 94.23.
Daily Benchmarks
- (Near-Term) 5 Day: 140.01 Down Trend,
- (Near-Term) 10 Day: 142.01 Down Trend,
- (Medium-Term) 20 Day: 151.60 Down Trend,
- (Medium-Term) 55 Day: 147.39 Down Trend,
- (Far-Term) 100 Day: 139.28 Down Trend,
- (Far-Term) 200 Day: 128.88 Up Trend.
Additional Metrics
- ATR: 138,
- VOLMA: 2577640.
Overall Rating
- Near-Term: Bearish,
- Medium-Term: Bearish,
- Far-Term: Neutral.
Key Insights Summary
From a futures swing-trading perspective, USO shows a corrective downswing rather than a confirmed bullish reversal. The decline from 171.82 to 135.01 represents approximately 21%, with the latest rebound stalling near the 100-day benchmark and below declining 5-day and 10-day averages. Price remains well beneath November’s monthly neutral zone, approximately 157–162, reinforcing the bearish medium-term structure. The pivot summary nevertheless classifies the combined high/low trend as neutral, reflecting mixed structural signals rather than a uniform downtrend across all horizons. The 135.01 low anchors the current downswing; 145.61 is the displayed opposite-pivot reversal threshold. Farther out, the rising 200-day average preserves a constructive longer-term component. Recent candles indicate stabilization, not yet a decisive recovery. Weekly and yearly grids and named signal-system readings are not visible, so their neutral entries are placeholders rather than confirmed signals. USO is an oil-futures-linked fund, not a futures contract; contract-roll effects can create differences from individual crude-oil futures. News and seasonal drivers cannot be established from this chart alone.
Chart Analysis ATS AI Generated: 2026-11-21 07:14 for Informational use only, not trading advice. Terms and Risk Disclosure Copyright © 2026. Algo Trading Systems LLC.