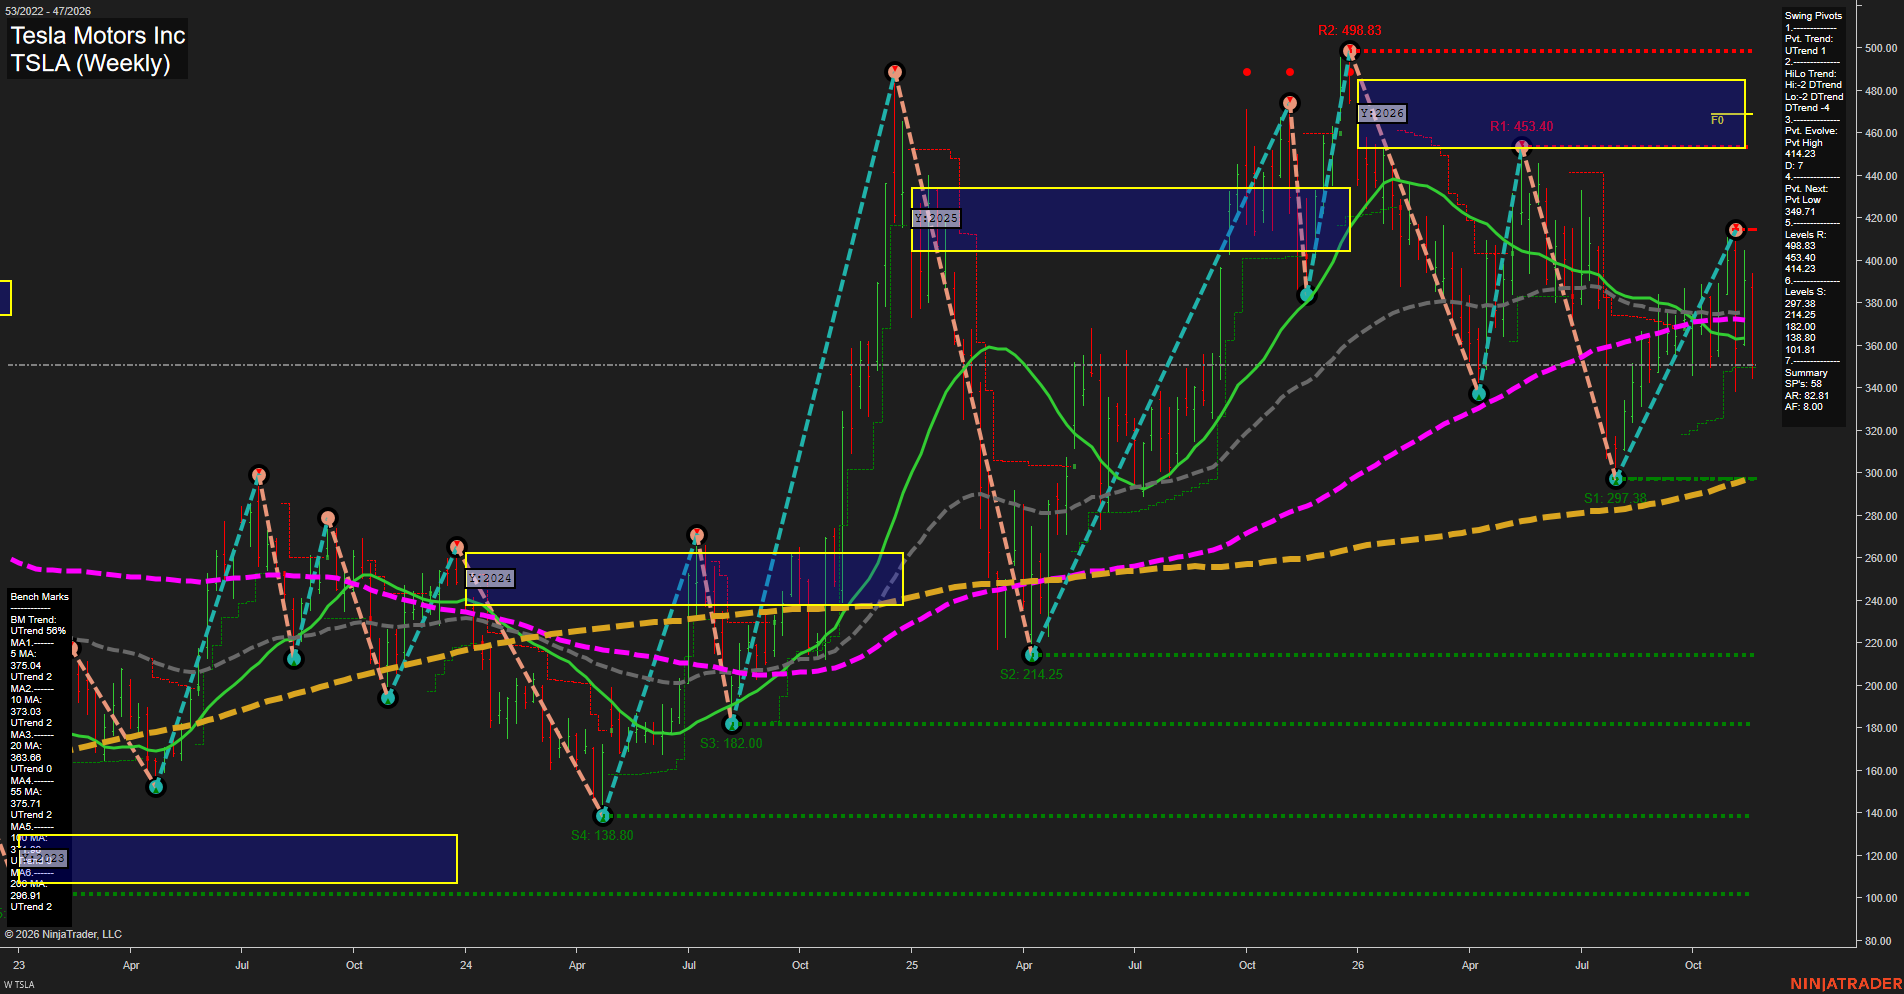
TSLA Tesla Motors Inc Weekly Chart Analysis — Pre-Open: 2026-Nov-21 07:13 CT
Price Action
- Last: Approximately 350,
- Bars: Large,
- Mom: Momentum fast to the downside.
WSFG Weekly
- Near-Term
- WSFG Current: NA%
- F0%/NTZ' Bias: Price Neutral,
- WSFG Trend: Neutral.
MSFG Month Nov
- Medium-Term
- MSFG Current: NA%
- F0%/NTZ' Bias: Price Neutral,
- MSFG Trend: Neutral.
YSFG Year 2026
- Far-Term
- YSFG Current: NA%
- F0%/NTZ' Bias: Price below F0% and NTZ,
- YSFG Trend: Bearish.
Swing Pivots
- (Near-Term) 1. Pvt. Trend: UTrend,
- (Medium-Term) 2. HiLo Trend: DTrend,
- 3. Pvt. Evolve: Pvt high 414.23,
- 4. Pvt. Next: Pvt low 349.71,
- 5. Levels R: 498.83, 453.40, 414.23,
- 6. Levels S: 297.38, 214.25, 182.00, 138.80, 101.81.
Weekly Benchmarks
- (Near-Term) 5 Week: 375.04 Up Trend,
- (Near-Term) 10 Week: 373.03 Up Trend,
- (Medium-Term) 20 Week: 363.66 Up Trend,
- (Medium-Term) 55 Week: 375.71 Up Trend,
- (Far-Term) 100 Week: Approximately 373 Up Trend,
- (Far-Term) 200 Week: 296.91 Up Trend.
Overall Rating
- Near-Term: Neutral,
- Medium-Term: Bearish,
- Far-Term: Neutral.
Key Insights Summary
From a futures swing trader’s perspective, this underlying equity chart shows a sharp downside rotation within a broad, volatile range rather than a clean trend continuation. The rebound from 297.38 established an evolving high at 414.23, below resistance at 453.40 and 498.83. The pivot summary still reports a near-term UTrend, but the medium-term high/low structure remains a DTrend. Price near 350 is below the approximately 364–376 benchmark cluster despite those averages retaining upward trend labels, highlighting a deterioration in price ahead of confirmed benchmark reversals. The listed next-pivot reversal level of 349.71 is close to current price. Structural support at 297.38 nearly coincides with the rising 200-week average at 296.91. Price also remains well below the 2026 yearly neutral zone, approximately 453–485. Weekly and monthly grids and the requested recent signal series are not displayed, so their directional confirmation is unavailable. The 100-week benchmark value is approximate because its summary is partly obscured. No news or seasonal catalyst can be established from this chart alone.
Chart Analysis ATS AI Generated: 2026-11-21 07:14 for Informational use only, not trading advice. Terms and Risk Disclosure Copyright © 2026. Algo Trading Systems LLC.