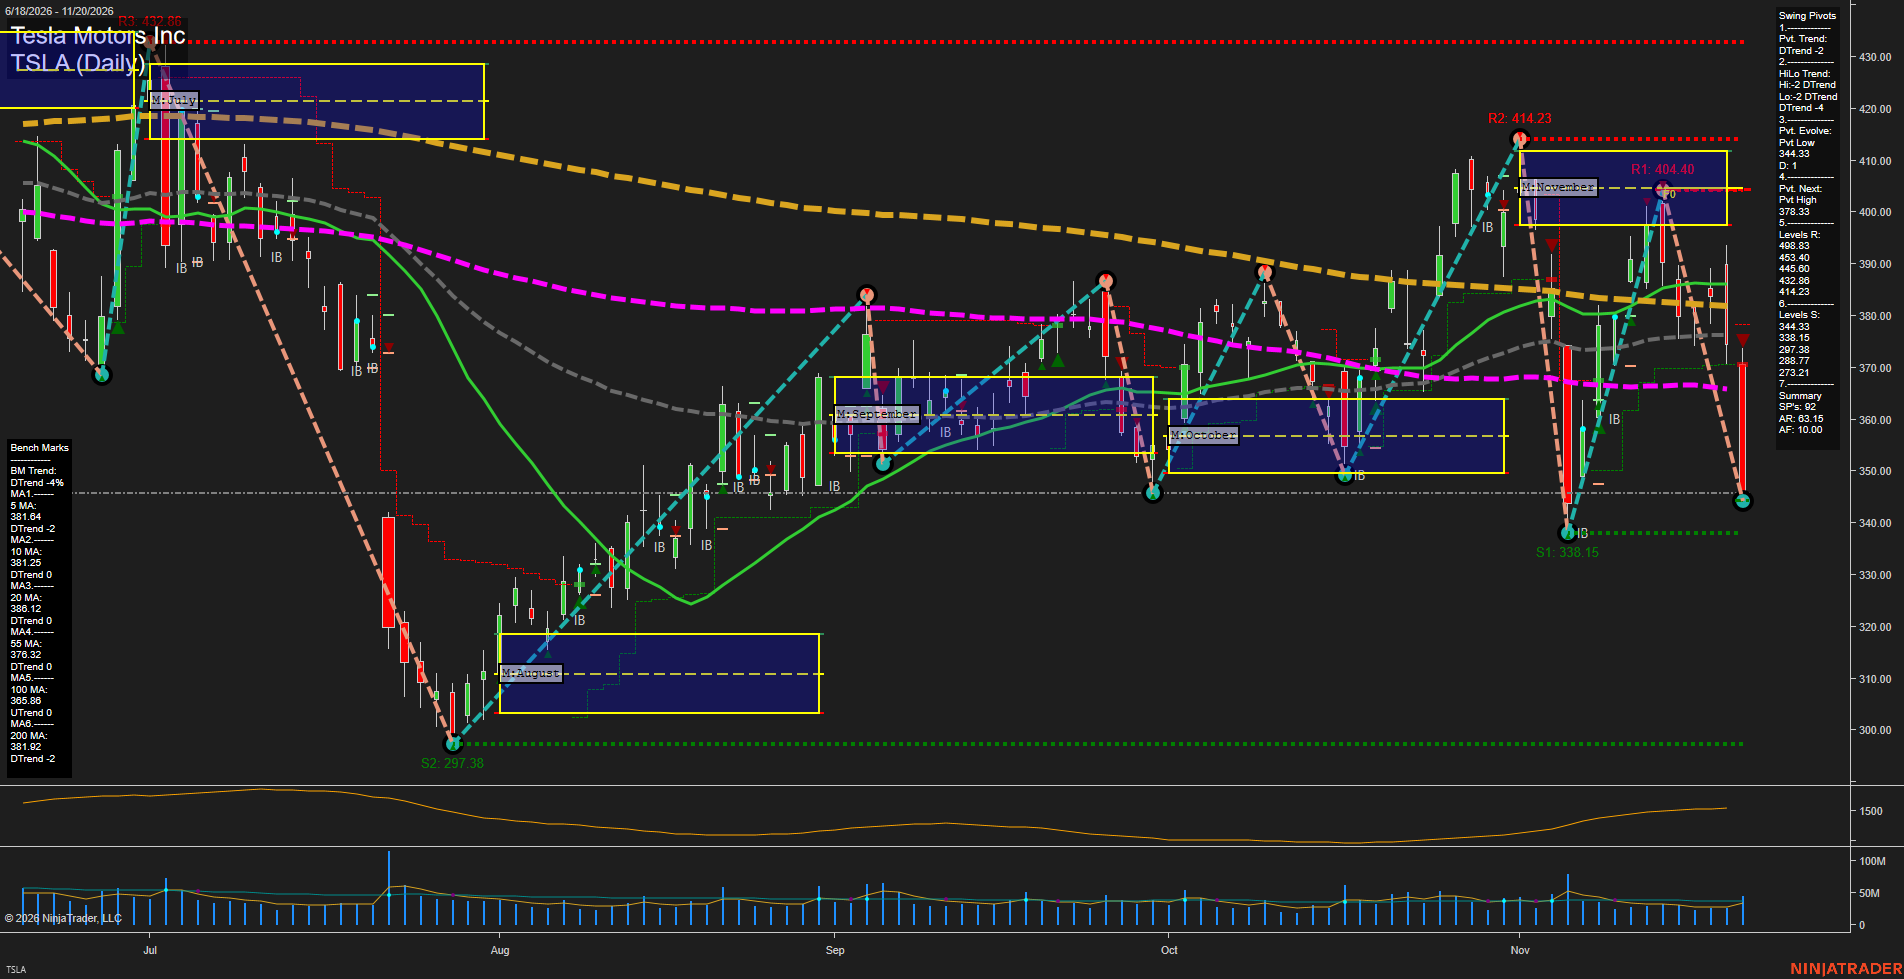
TSLA Tesla Motors Inc Daily Chart Analysis — Pre-Open: 2026-Nov-21 07:13 CT
Price Action
- Last: approximately 344.33,
- Bars: Large,
- Mom: Momentum fast to the downside.
WSFG Weekly
- Near-Term
- WSFG Current: NA%
- F0%/NTZ' Bias: Not visible,
- WSFG Trend: Not assessable.
MSFG Month Nov
- Medium-Term
- MSFG Current: NA%
- F0%/NTZ' Bias: Price below F0% and NTZ,
- MSFG Trend: Bearish.
YSFG Year 2026
- Far-Term
- YSFG Current: NA%
- F0%/NTZ' Bias: Not visible,
- YSFG Trend: Not assessable.
Swing Pivots
- (Near-Term) 1. Pvt. Trend: DTrend,
- (Medium-Term) 2. HiLo Trend: DTrend,
- 3. Pvt. Evolve: Pvt low 344.33,
- 4. Pvt. Next: Pvt high 378.33,
- 5. Levels R: 498.83, 453.40, 445.60, 432.86, 414.23,
- 6. Levels S: 344.33, 338.15, 297.38, 288.77, 273.21.
Daily Benchmarks
- (Near-Term) 5 Day: 381.64 Down Trend,
- (Near-Term) 10 Day: 381.25 Down Trend,
- (Medium-Term) 20 Day: 386.12 Down Trend,
- (Medium-Term) 55 Day: 376.32 Down Trend,
- (Far-Term) 100 Day: 365.86 Up Trend,
- (Far-Term) 200 Day: 381.92 Down Trend.
Additional Metrics
- ATR: 2032,
- VOLMA: 72571229.
Overall Rating
- Near-Term: Bearish,
- Medium-Term: Bearish,
- Far-Term: Bearish.
Key Insights Summary
From a futures swing-trading perspective, this underlying equity chart shows a fast downside leg within a volatile, two-sided November range. The rebound failed near 404.40, below the prior 414.23 swing high, and price subsequently fell beneath every benchmark average. Both pivot trends are down, while the developing 344.33 low remains above 338.15 support: a lower high is established, but a fresh break below the November swing low is not. The November NTZ around 398–412 now sits substantially overhead. The rising 100-day average is the principal longer-horizon bullish exception, although price is below it. The ATR plot has recently risen, consistent with expanding swing ranges. ATR and VOLMA values above are supplied figures; their exact readings and scaling are not independently legible in the image. Weekly and yearly grids and the named trade-signal summaries are not visible. News and seasonal drivers cannot be established from this chart.
Chart Analysis ATS AI Generated: 2026-11-21 07:13 for Informational use only, not trading advice. Terms and Risk Disclosure Copyright © 2026. Algo Trading Systems LLC.