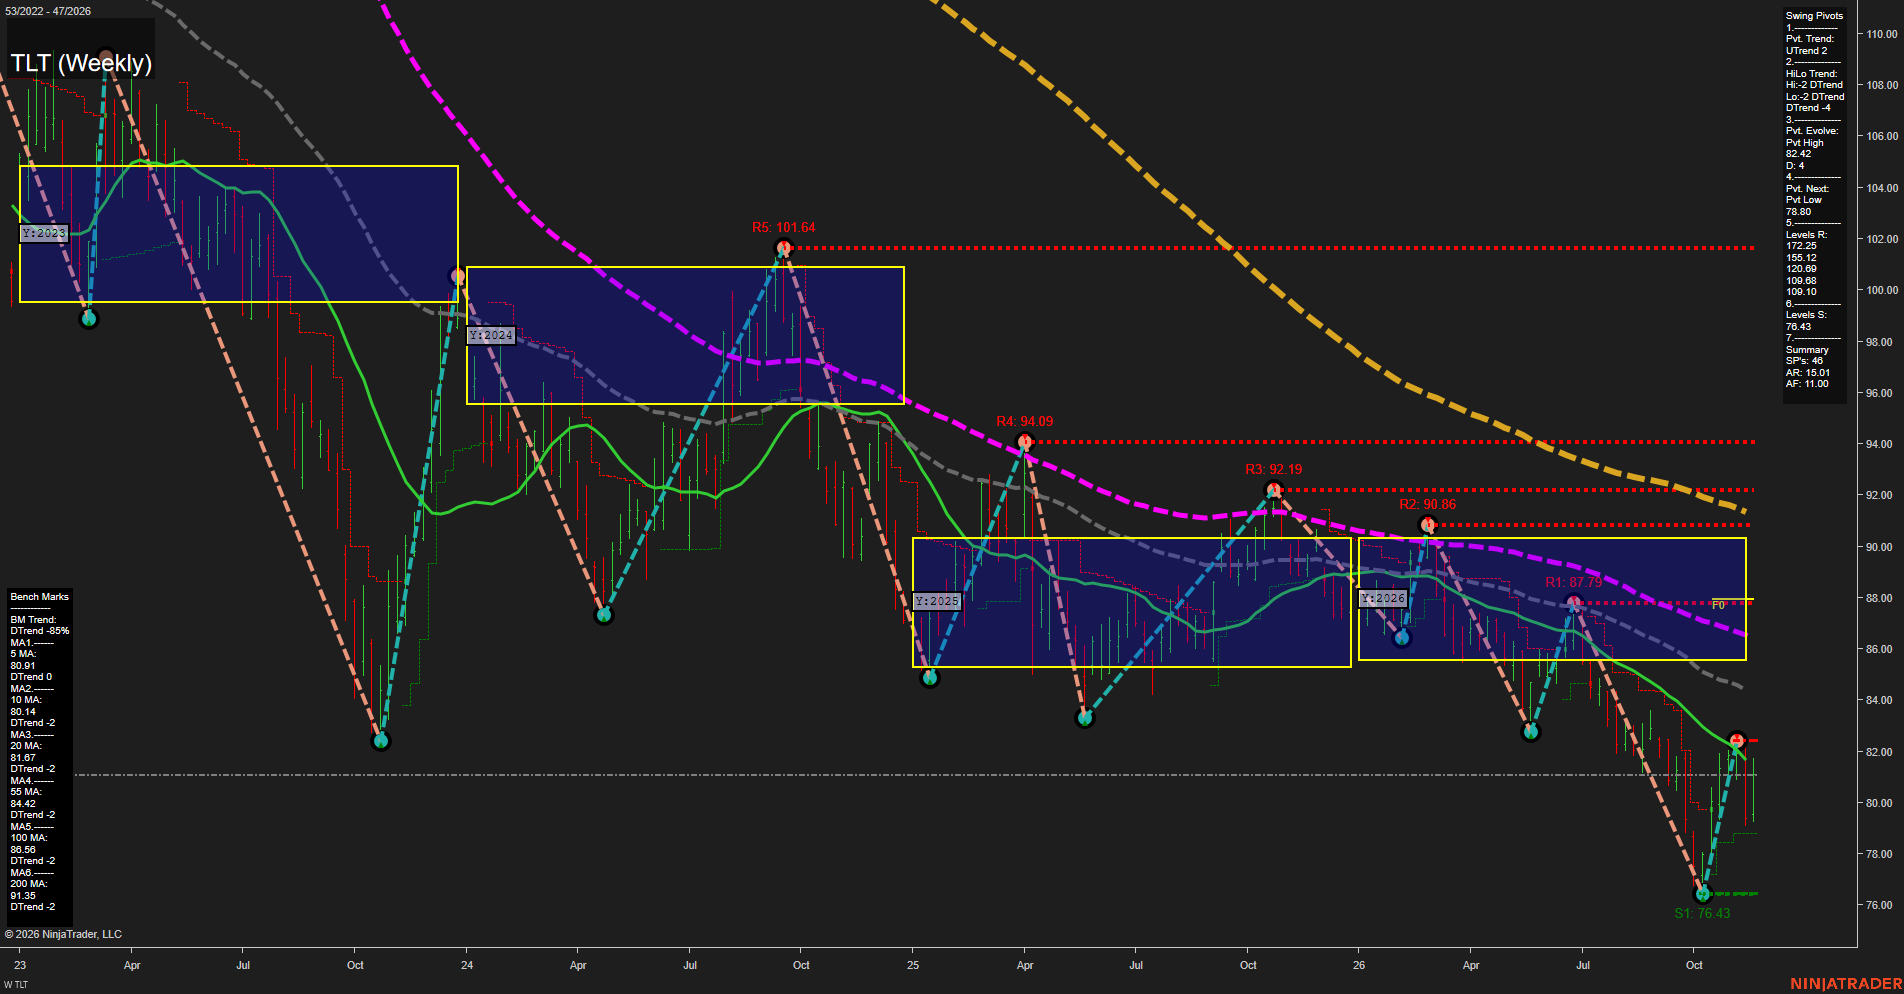
From a futures swing-trading perspective, TLT shows a countertrend bond-price rebound within a persistent larger downtrend, rather than a confirmed trend reversal. The recovery from 76.43 produced an evolving pivot high at 82.42, but the medium-term pivot structure still contains lower highs and lower lows. Price is approximately above the declining 5- and 10-week benchmarks while below all four longer benchmarks, explaining the mixed near-term and bearish broader ratings. The 78.80 pivot-reversal threshold distinguishes the current upswing from a renewed downward pivot sequence. The chart plots nearer resistance at 87.79, 90.86, 92.19, 94.09 and 101.64; these differ from the resistance values displayed in the Swing Pivots summary reproduced above. Although the required grid fields are shown as neutral placeholders, price is visibly below the 2026 yearly NTZ and its F0 line near 87.8, indicating weak annual positioning. Weekly/monthly grid readings and the named recent signal series are not visible, so their directions cannot be independently confirmed. TLT is an ETF proxy for long-duration Treasury exposure, not a Treasury futures contract; contract pricing and delivery characteristics differ. No news or seasonal catalyst is established by this image.