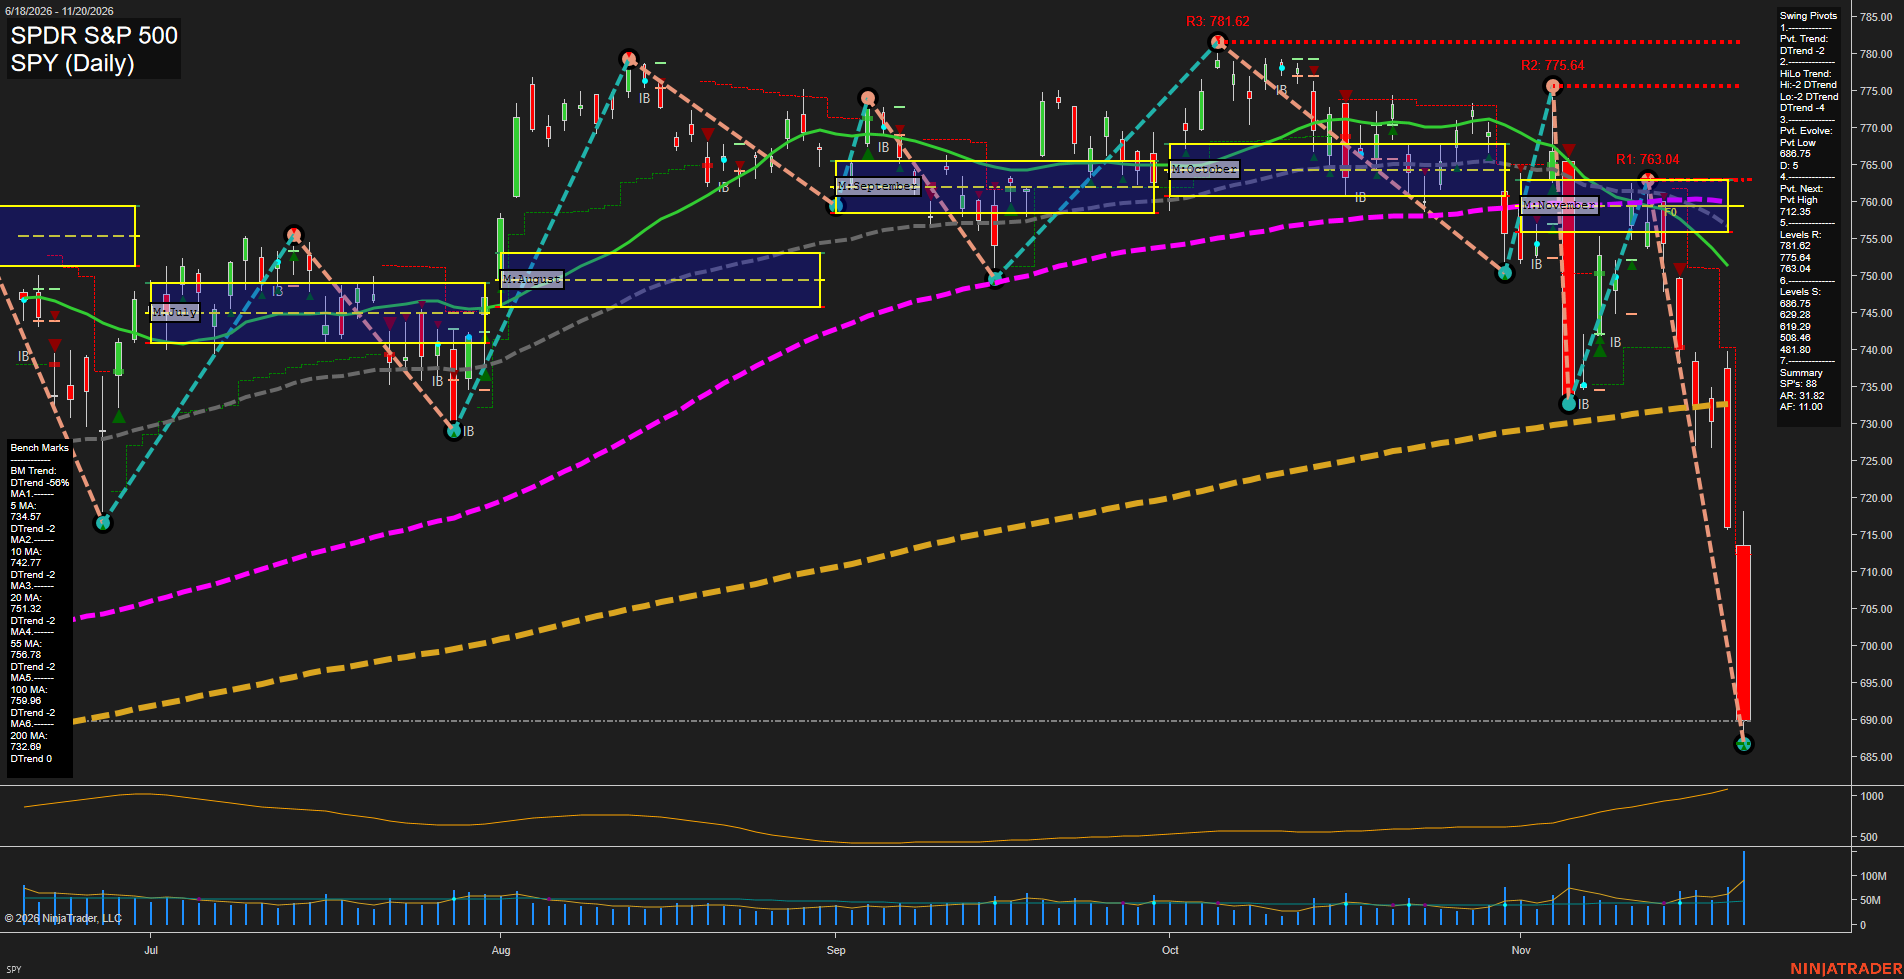
SPY SPDR S&P 500 Daily Chart Analysis — Pre-Open: 2026-Nov-21 07:12 CT
Price Action
- Last: Approximately 690,
- Bars: Large,
- Mom: Fast downside momentum.
WSFG Weekly
- Near-Term
- WSFG Current: NA%
- F0%/NTZ' Bias: Not displayed,
- WSFG Trend: Not verifiable.
MSFG Month Nov
- Medium-Term
- MSFG Current: NA%
- F0%/NTZ' Bias: Price below F0% and NTZ,
- MSFG Trend: Bearish.
YSFG Year 2026
- Far-Term
- YSFG Current: NA%
- F0%/NTZ' Bias: Not displayed,
- YSFG Trend: Not verifiable.
Swing Pivots
- (Near-Term) 1. Pvt. Trend: DTrend,
- (Medium-Term) 2. HiLo Trend: DTrend,
- 3. Pvt. Evolve: Pvt low 686.75,
- 4. Pvt. Next: Pvt high 712.35,
- 5. Levels R: 781.62, 775.64, 763.04,
- 6. Levels S: 686.75, 629.28, 619.29, 508.46, 481.80.
Daily Benchmarks
- (Near-Term) 5 Day: 734.57 Down Trend,
- (Near-Term) 10 Day: 742.77 Down Trend,
- (Medium-Term) 20 Day: 751.32 Down Trend,
- (Medium-Term) 55 Day: 756.78 Down Trend,
- (Far-Term) 100 Day: 759.96 Down Trend,
- (Far-Term) 200 Day: 732.69 Neutral Trend.
Additional Metrics
- ATR: Approximately 1100,
- VOLMA: Approximately 90000000.
Overall Rating
- Near-Term: Bearish,
- Medium-Term: Bearish,
- Far-Term: Bearish.
Key Insights Summary
From a futures swing trader’s perspective, SPY depicts an accelerating bearish expansion rather than an orderly pullback. Lower swing highs, a developing 686.75 pivot low, and consecutive large declining candles establish downside control. Price has broken beneath every benchmark, including the 200-day average, while November’s monthly balance zone near 756–763 now sits well overhead. Rising ATR and elevated volume reinforce the expansion in realized volatility; the lower wick shows some recovery from the session low, but does not establish a reversal. The 712.35 next-pivot threshold is a structural reference, not confirmation of a broader trend change. These are SPY levels, not directly transferable futures contract prices. Weekly/yearly grids and the named USAR signal readings are not visible; news catalysts and seasonal explanations cannot be verified from this chart. ATR and VOLMA are approximate visual readings because exact latest values are not labeled.
Chart Analysis ATS AI Generated: 2026-11-21 07:13 for Informational use only, not trading advice. Terms and Risk Disclosure Copyright © 2026. Algo Trading Systems LLC.