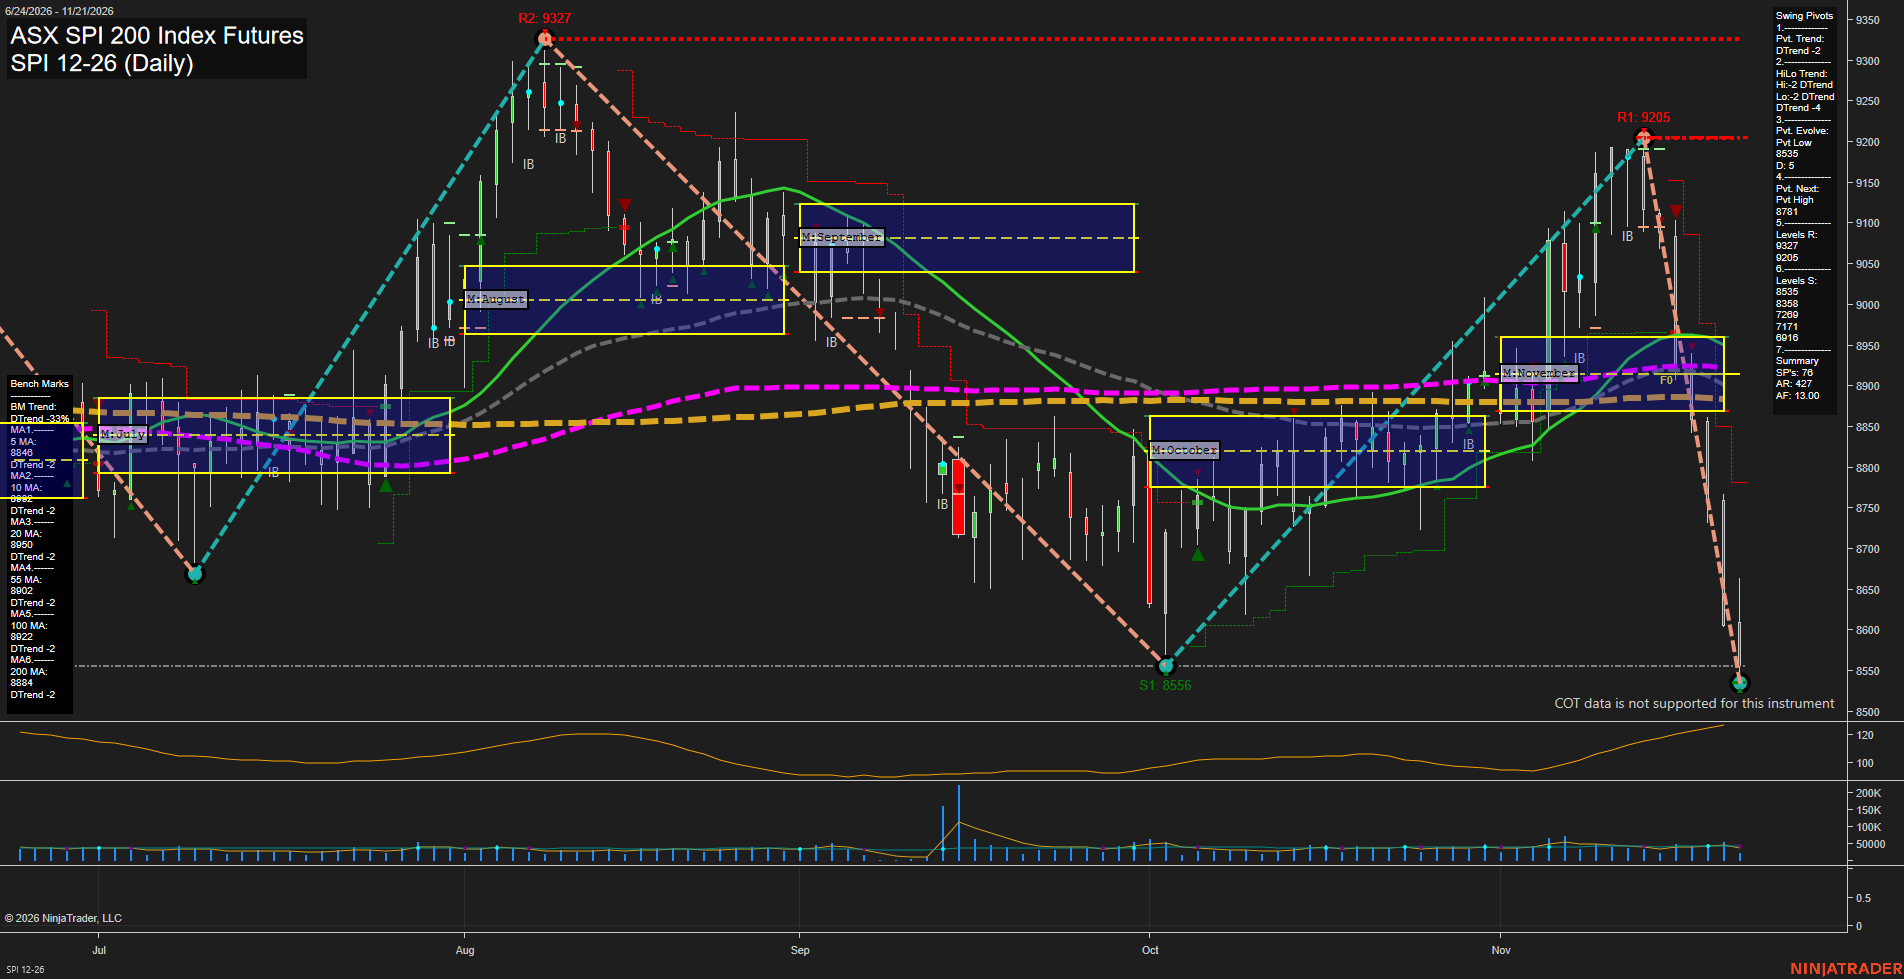
SPI ASX SPI 200 Index Futures Daily Chart Analysis — Pre-Open: 2026-Nov-21 07:12 CT
Price Action
- Last: approximately 8556,
- Bars: Large,
- Mom: Momentum fast.
WSFG Weekly
- Near-Term
- WSFG Current: NA%
- F0%/NTZ' Bias: Price Neutral,
- WSFG Trend: Neutral.
MSFG Month Nov
- Medium-Term
- MSFG Current: NA%
- F0%/NTZ' Bias: Price Below NTZ,
- MSFG Trend: Bearish.
YSFG Year 2026
- Far-Term
- YSFG Current: NA%
- F0%/NTZ' Bias: Price Neutral,
- YSFG Trend: Neutral.
Swing Pivots
- (Near-Term) 1. Pvt. Trend: DTrend,
- (Medium-Term) 2. HiLo Trend: DTrend,
- 3. Pvt. Evolve: Pvt low 8535,
- 4. Pvt. Next: Pvt high 8781,
- 5. Levels R: 9327, 9205,
- 6. Levels S: 8535, 8358, 7269, 7171, 6916.
Daily Benchmarks
- (Near-Term) 5 Day: 8846 Down Trend,
- (Near-Term) 10 Day: approximately 8952 Down Trend,
- (Medium-Term) 20 Day: 8950 Down Trend,
- (Medium-Term) 55 Day: 8902 Down Trend,
- (Far-Term) 100 Day: 8922 Down Trend,
- (Far-Term) 200 Day: 8884 Down Trend.
Additional Metrics
Overall Rating
- Near-Term: Bearish,
- Medium-Term: Bearish,
- Far-Term: Bearish.
Key Insights Summary
The November rally reversed sharply from 9205, producing an approximately 670-point downswing to the evolving 8535 low. Large downside bars and accelerating momentum characterize a selloff rather than an orderly pullback. Price has breached the November monthly neutral zone, fallen below every benchmark average, and undercut the October swing low near 8556. Lower swing highs and lows reinforce the bearish structure across time horizons. The 8535 evolving low and 8358 support define the closest downside reference levels; 8781 is the summary's next pivot-high reversal threshold. Weekly and yearly grids are not displayed, so their neutral entries do not establish independent confirmation. Recent named signal readings, news catalysts, and seasonal evidence are unavailable in this chart.
Chart Analysis ATS AI Generated: 2026-11-21 07:12 for Informational use only, not trading advice. Terms and Risk Disclosure Copyright © 2026. Algo Trading Systems LLC.