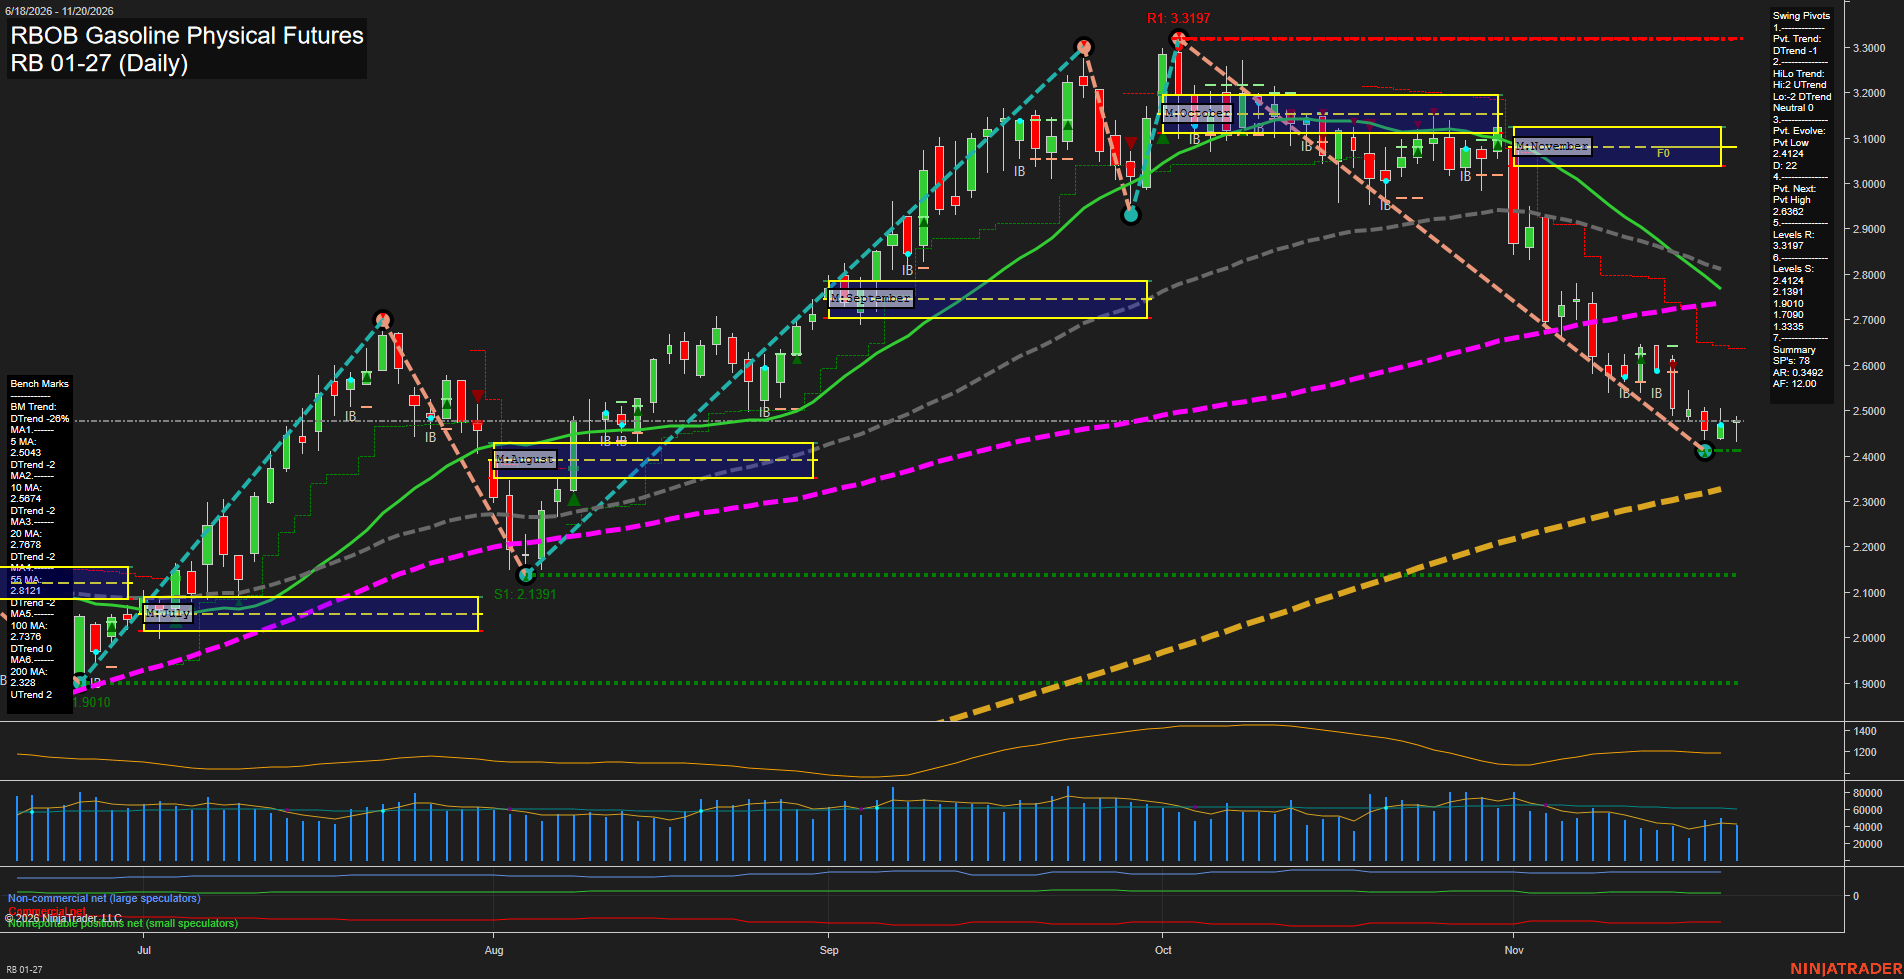
RB RBOB Gasoline Physical Futures Daily Chart Analysis — Pre-Open: 2026-Nov-21 07:11 CT
Price Action
- Last: approximately 2.4800,
- Bars: Small,
- Mom: Momentum slow.
WSFG Weekly
- Near-Term
- WSFG Current: -54%
- F0%/NTZ' Bias: Price Below,
- WSFG Trend: Down.
MSFG Month Nov
- Medium-Term
- MSFG Current: -127%
- F0%/NTZ' Bias: Price Below,
- MSFG Trend: Down.
YSFG Year 2026
- Far-Term
- YSFG Current: 174%
- F0%/NTZ' Bias: Price Above,
- YSFG Trend: Up.
Swing Pivots
- (Near-Term) 1. Pvt. Trend: DTrend,
- (Medium-Term) 2. HiLo Trend: Neutral (highs UTrend; lows DTrend),
- 3. Pvt. Evolve: Pvt low 2.4124,
- 4. Pvt. Next: Pvt high 2.6362,
- 5. Levels R: 3.3197,
- 6. Levels S: 2.4124, 2.1391, 1.9010, 1.7090, 1.3335.
Daily Benchmarks
- (Near-Term) 5 Day: 2.5043 Down Trend,
- (Near-Term) 10 Day: 2.5674 Down Trend,
- (Medium-Term) 20 Day: 2.7678 Down Trend,
- (Medium-Term) 55 Day: 2.8121 Down Trend,
- (Far-Term) 100 Day: 2.7376 Down Trend,
- (Far-Term) 200 Day: 2.328 Up Trend.
Additional Metrics
Recent Trade Signals
- 16 Nov 2026: Short RB 12-26 @ 2.6023 Signals.USAR-WSFG
Overall Rating
- Near-Term: Bearish,
- Medium-Term: Bearish,
- Far-Term: Bullish.
Key Insights Summary
The dominant swing remains downward from the 3.3197 peak, with price below the weekly and monthly grids and all benchmarks through the 100-day average. Small recent candles and a modest rebound from 2.4124 indicate slowing downside momentum, not a confirmed trend reversal; the next opposite-pivot threshold is 2.6362. The 5-day and 10-day averages remain overhead, while the declining 20-day and 55-day benchmarks reinforce medium-term weakness. Far-term conditions remain bullish by the supplied metric majority—positive yearly grid positioning and a rising 200-day average—but the declining 100-day benchmark shows substantial deterioration within that broader backdrop. The evolving low at 2.4124 is the nearest chart support, followed by 2.1391. The supplied short signal references December futures, whereas the displayed chart is January futures, so their price levels are not directly interchangeable. No specific news catalyst can be established from this chart alone.
Chart Analysis ATS AI Generated: 2026-11-21 07:11 for Informational use only, not trading advice. Terms and Risk Disclosure Copyright © 2026. Algo Trading Systems LLC.