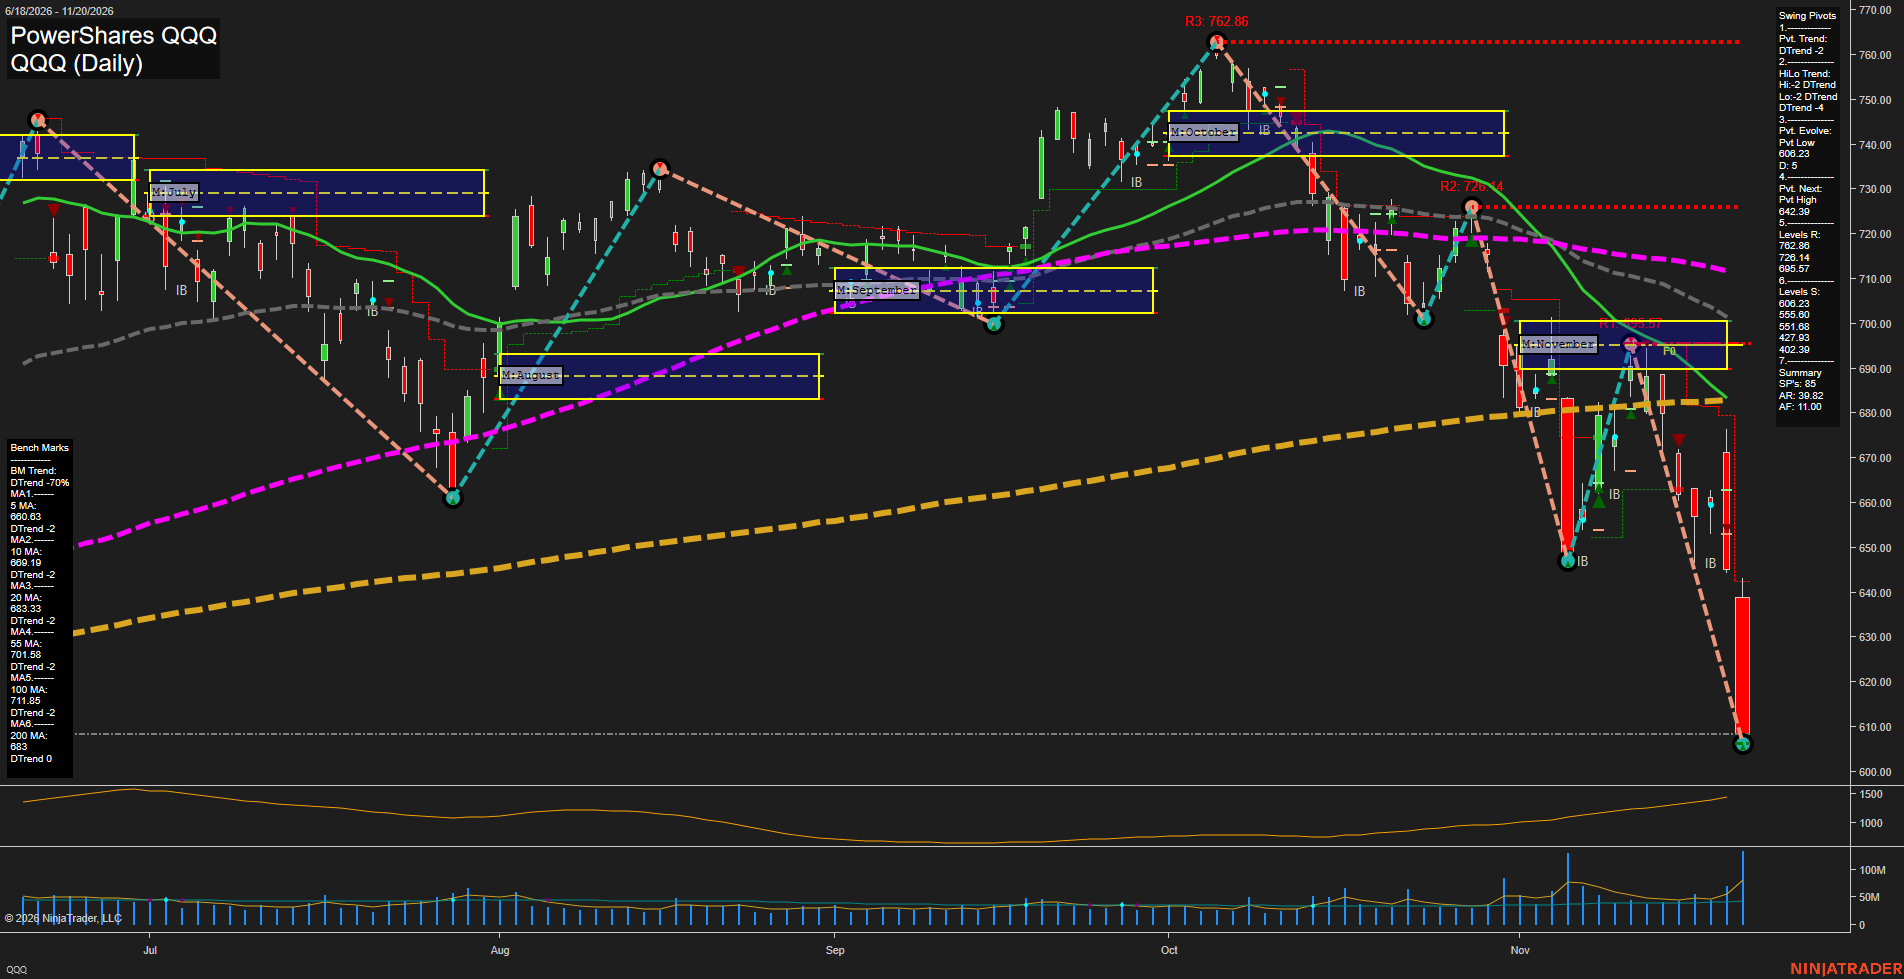
QQQ PowerShares QQQ Daily Chart Analysis — Pre-Open: 2026-Nov-21 07:10 CT
Price Action
- Last: Approximately 608.5,
- Bars: Large,
- Mom: Momentum fast.
WSFG Weekly
- Near-Term
- WSFG Current: NA%
- F0%/NTZ' Bias: Not visible,
- WSFG Trend: Not available.
MSFG Month Nov
- Medium-Term
- MSFG Current: NA%
- F0%/NTZ' Bias: Price Bearish,
- MSFG Trend: Bearish.
YSFG Year 2026
- Far-Term
- YSFG Current: NA%
- F0%/NTZ' Bias: Not visible,
- YSFG Trend: Not available.
Swing Pivots
- (Near-Term) 1. Pvt. Trend: DTrend,
- (Medium-Term) 2. HiLo Trend: DTrend,
- 3. Pvt. Evolve: Pvt low 606.23,
- 4. Pvt. Next: Pvt high 642.39,
- 5. Levels R: 762.86, 726.14, 695.57,
- 6. Levels S: 606.23, 555.60, 551.68, 427.93, 402.39.
Daily Benchmarks
- (Near-Term) 5 Day: 660.63 Down Trend,
- (Near-Term) 10 Day: 669.19 Down Trend,
- (Medium-Term) 20 Day: 683.33 Down Trend,
- (Medium-Term) 55 Day: 701.58 Down Trend,
- (Far-Term) 100 Day: 711.85 Down Trend,
- (Far-Term) 200 Day: 683.00 Flat Trend.
Additional Metrics
- ATR: 733,
- VOLMA: 32709273.
Overall Rating
- Near-Term: Bearish,
- Medium-Term: Bearish,
- Far-Term: Bearish.
Key Insights Summary
From a Nasdaq futures swing-trading perspective, QQQ depicts an accelerating bearish underlying-market regime, not a futures-contract price chart. Lower swing highs at 762.86, 726.14 and 695.57 accompany lower lows, with the latest large red candle closing near its 606.23 evolving pivot low. The rebound into November resistance failed, followed by renewed downside expansion and elevated selling volume. Price is below every benchmark and well beneath November’s approximately 690–700 neutral zone, confirming a breakdown rather than a normal consolidation. Near- and medium-term trends align bearishly; the far-term assessment is bearish because price is below both long-term benchmarks, although the 200-day average itself remains flat. The 642.39 next-pivot threshold represents a potential structural reversal marker, not an established reversal. Weekly/yearly grids and the named trade-signal series are not visible; news and seasonal effects cannot be established from this chart. ATR and VOLMA above are supplied template values rather than independently verified readings from the image.
Chart Analysis ATS AI Generated: 2026-11-21 07:11 for Informational use only, not trading advice. Terms and Risk Disclosure Copyright © 2026. Algo Trading Systems LLC.