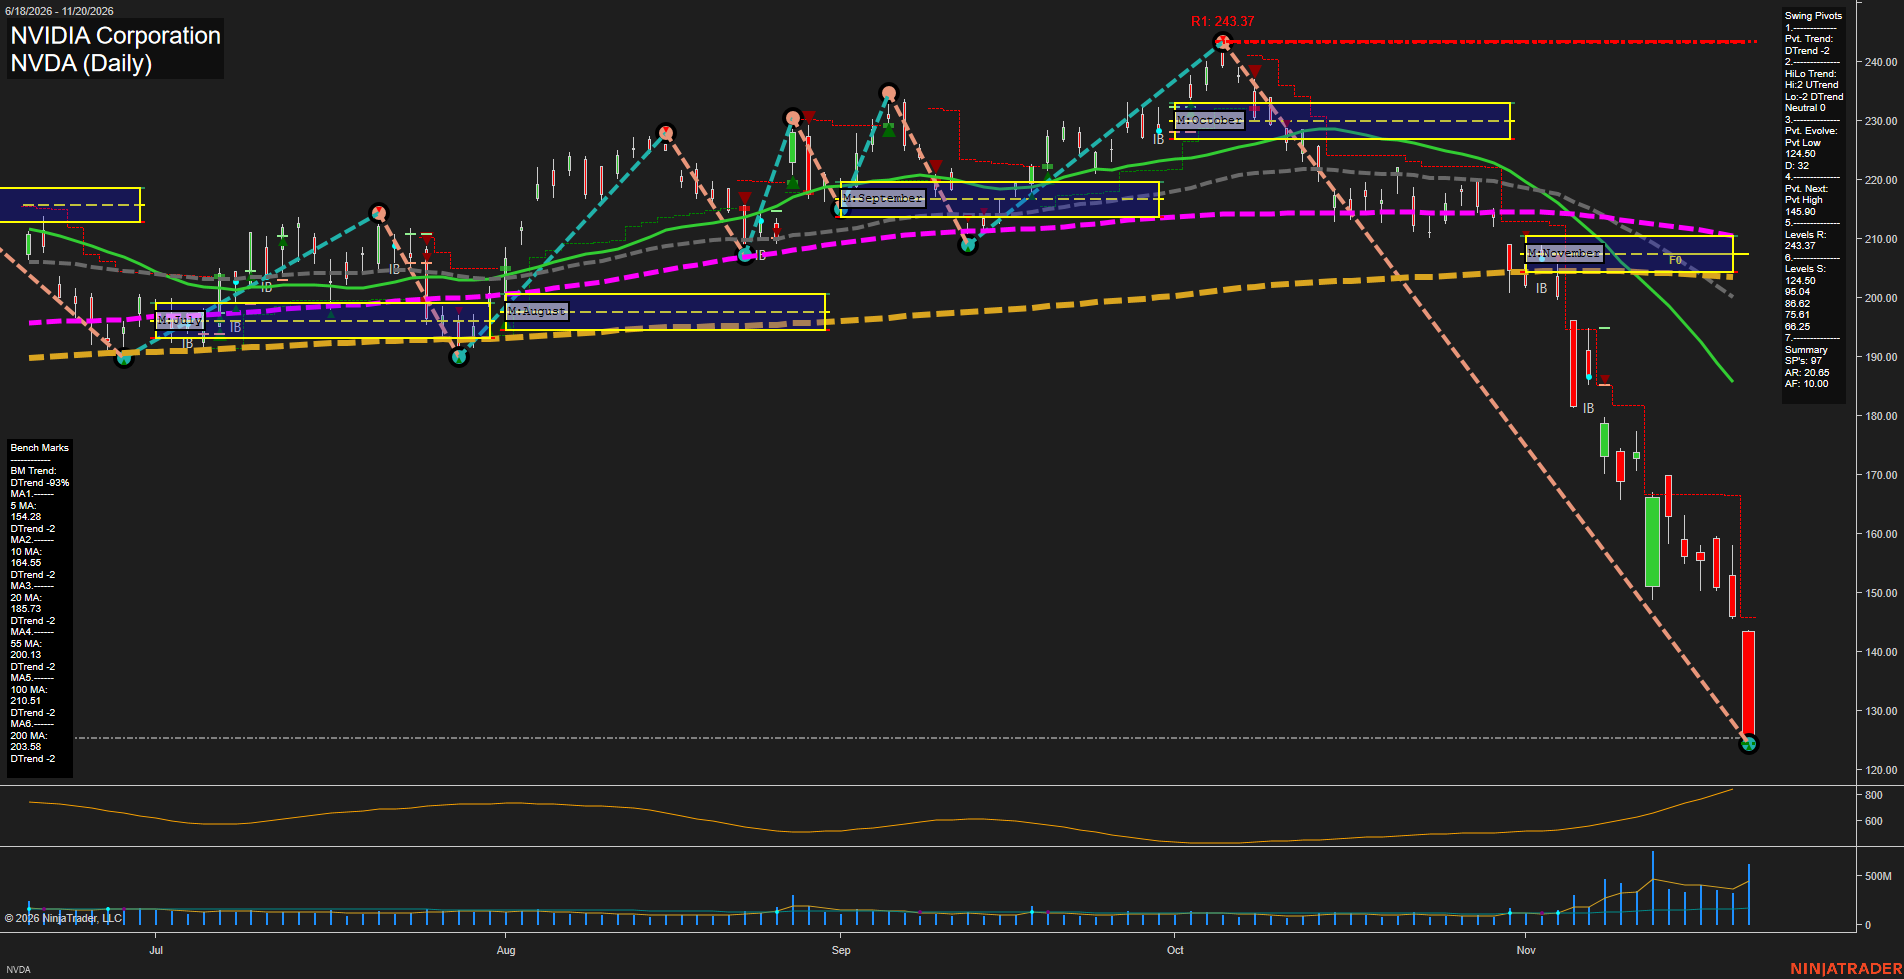
NVDA NVIDIA Corporation Daily Chart Analysis — Pre-Open: 2026-Nov-21 07:10 CT
Price Action
- Last: Approximately 125,
- Bars: Large,
- Mom: Fast downside momentum.
WSFG Weekly
- Near-Term
- WSFG Current: NA%
- F0%/NTZ' Bias: Price Neutral,
- WSFG Trend: Neutral.
MSFG Month Nov
- Medium-Term
- MSFG Current: NA%
- F0%/NTZ' Bias: Price Bearish,
- MSFG Trend: Bearish.
YSFG Year 2026
- Far-Term
- YSFG Current: NA%
- F0%/NTZ' Bias: Price Neutral,
- YSFG Trend: Neutral.
Swing Pivots
- (Near-Term) 1. Pvt. Trend: DTrend,
- (Medium-Term) 2. HiLo Trend: Neutral; highs UTrend, lows DTrend,
- 3. Pvt. Evolve: Pvt low 124.50,
- 4. Pvt. Next: Pvt high 145.90,
- 5. Levels R: 243.37,
- 6. Levels S: 124.50, 95.04, 88.62, 75.61, 66.25.
Daily Benchmarks
- (Near-Term) 5 Day: 154.28 Down Trend,
- (Near-Term) 10 Day: 164.55 Down Trend,
- (Medium-Term) 20 Day: 185.73 Down Trend,
- (Medium-Term) 55 Day: 200.13 Down Trend,
- (Far-Term) 100 Day: 210.51 Down Trend,
- (Far-Term) 200 Day: 203.58 Down Trend.
Additional Metrics
- ATR: 599,
- VOLMA: 346637249.
Overall Rating
- Near-Term: Bearish,
- Medium-Term: Bearish,
- Far-Term: Bearish.
Key Insights Summary
From a futures swing trader’s perspective, the dominant feature is an accelerating downside impulse rather than a routine pullback. Price has fallen approximately 49% from the 243.37 swing high and is testing the evolving 124.50 pivot low. Large bearish candles, elevated recent volume and widening daily ranges indicate forceful directional expansion. Price is below all six declining benchmarks and substantially below November’s approximately 204–210 NTZ, confirming broad technical deterioration. The mixed medium-term pivot classification reflects a prior higher high followed by a lower low, rather than a uniformly established lower-high/lower-low sequence. The 145.90 next-pivot threshold is a structural reference, not an existing confirmed swing resistance. Weekly and yearly grids are not visible; their neutral entries represent unavailable confirmation. The named trade-signal series, news catalysts and seasonal effects cannot be verified from this chart. ATR and VOLMA above are supplied values; the ATR unit convention is not identifiable from the image. This is an NVDA equity chart, so futures-specific contract volume, basis and overnight-session behavior are not represented.
Chart Analysis ATS AI Generated: 2026-11-21 07:10 for Informational use only, not trading advice. Terms and Risk Disclosure Copyright © 2026. Algo Trading Systems LLC.