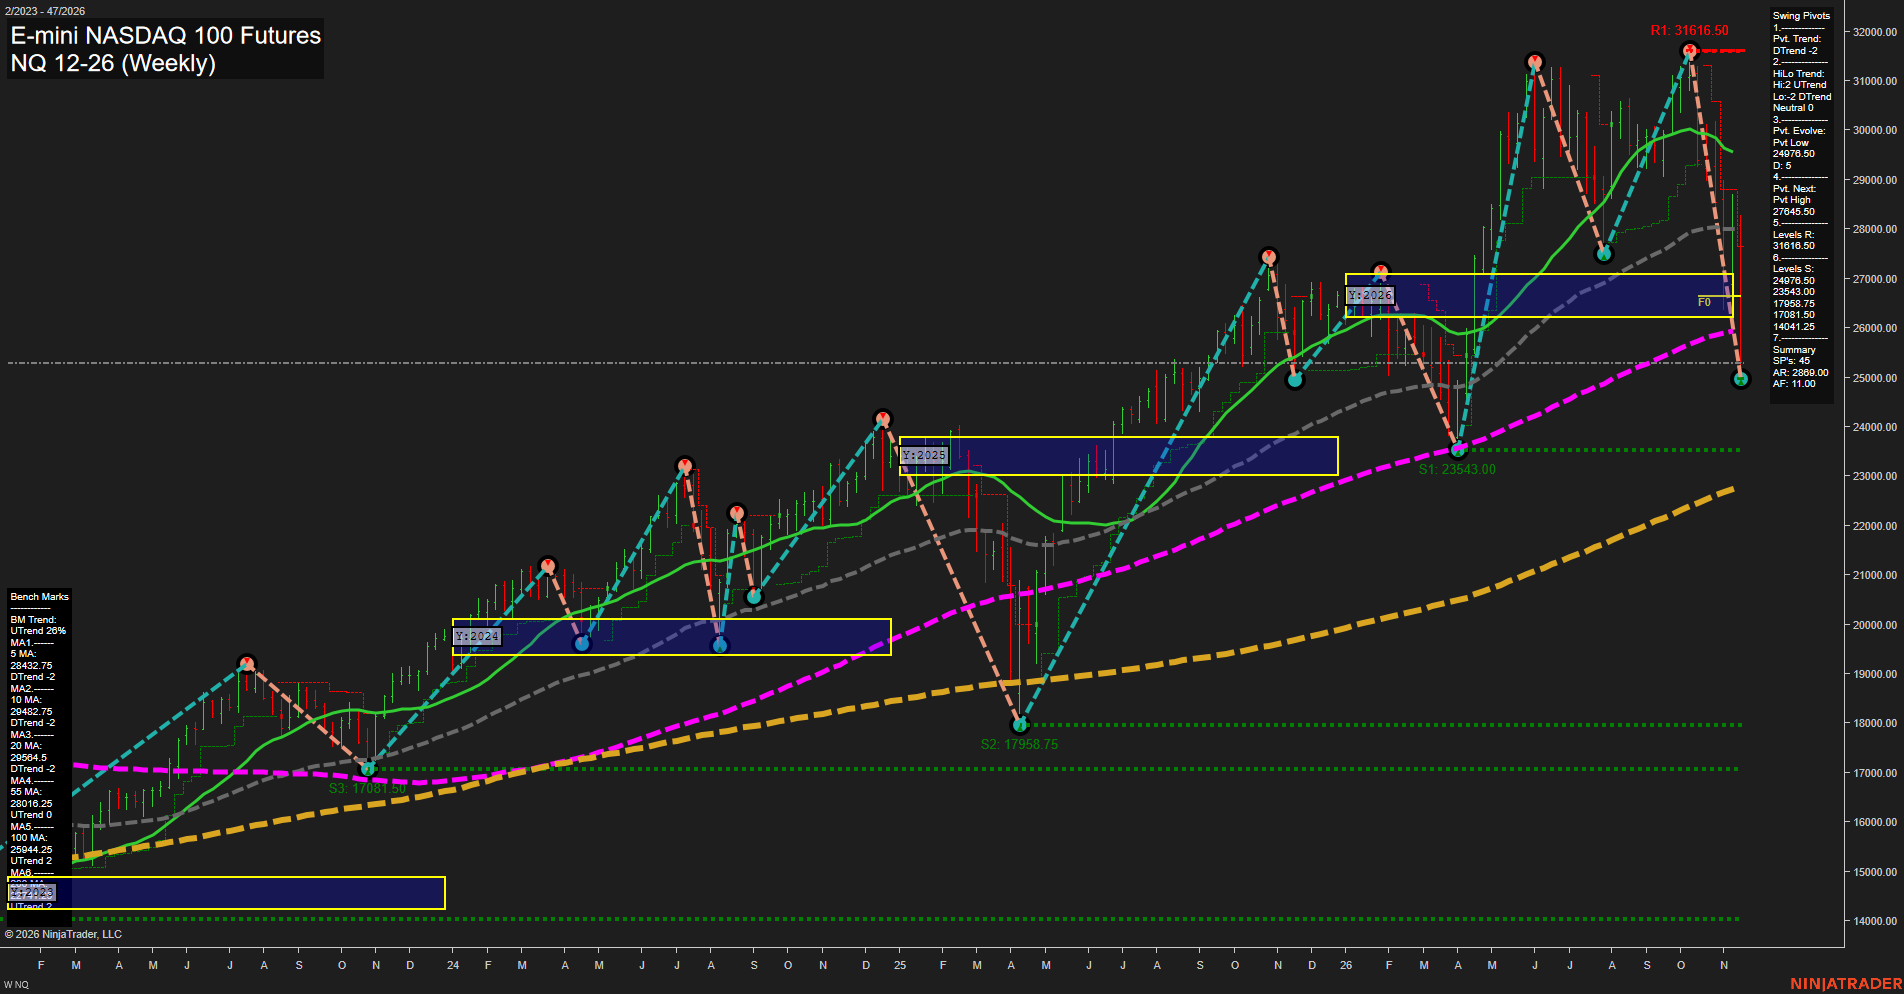
NQ E-mini NASDAQ 100 Futures Weekly Chart Analysis — Pre-Open: 2026-Nov-21 07:10 CT
Price Action
- Last: Approximately 24,980,
- Bars: Large,
- Mom: Momentum fast.
WSFG Weekly
- Near-Term
- WSFG Current: -146%
- F0%/NTZ' Bias: Price Below,
- WSFG Trend: Down.
MSFG Month Nov
- Medium-Term
- MSFG Current: -140%
- F0%/NTZ' Bias: Price Below,
- MSFG Trend: Down.
YSFG Year 2026
- Far-Term
- YSFG Current: -31%
- F0%/NTZ' Bias: Price Below,
- YSFG Trend: Down.
Swing Pivots
- (Near-Term) 1. Pvt. Trend: DTrend,
- (Medium-Term) 2. HiLo Trend: Neutral,
- 3. Pvt. Evolve: Pvt low 24,976.50,
- 4. Pvt. Next: Pvt high 27,645.50,
- 5. Levels R: 31,616.50,
- 6. Levels S: 24,976.50, 23,543.00, 17,958.75, 17,081.50, 14,041.25.
Weekly Benchmarks
- (Near-Term) 5 Week: 28,432.75 Down Trend,
- (Near-Term) 10 Week: 29,482.75 Down Trend,
- (Medium-Term) 20 Week: 29,564.50 Down Trend,
- (Medium-Term) 55 Week: 28,016.25 Up Trend,
- (Far-Term) 100 Week: 25,944.25 Up Trend,
- (Far-Term) 200 Week: Approximately 22,741 Up Trend.
Recent Trade Signals
- 16 Nov 2026: Short NQ 12-26 @ 27861.25 Signals.USAR.TR120
- 16 Nov 2026: Short NQ 12-26 @ 27861.25 Signals.USAR-WSFG
Overall Rating
- Near-Term: Bearish,
- Medium-Term: Bearish,
- Far-Term: Neutral.
Key Insights Summary
The weekly swing structure shows a fast selloff from 31,616.50 into the evolving 24,976.50 pivot low, a decline of approximately 21%. Large downside bars, falling 5-, 10- and 20-week benchmarks, and the supplied near-term short signals reinforce bearish momentum. The chart reports a neutral HiLo trend because higher pivot highs coexist with lower pivot lows, indicating an expanding, volatile structure rather than an orderly downtrend. Price is below the yearly NTZ and the rising 55- and 100-week benchmarks, while remaining above the rising 200-week benchmark. This leaves longer-term trend damage significant but not uniform. The 24,976.50 and 23,543.00 support levels define the nearest downside reference points; 27,645.50 is the reported opposite-pivot reversal threshold, not a confirmed swing-high resistance. Far-term conditions remain mixed between declining yearly-grid positioning and rising long-duration averages. No news catalyst or seasonal conclusion can be established from this chart alone.
Chart Analysis ATS AI Generated: 2026-11-21 07:10 for Informational use only, not trading advice. Terms and Risk Disclosure Copyright © 2026. Algo Trading Systems LLC.