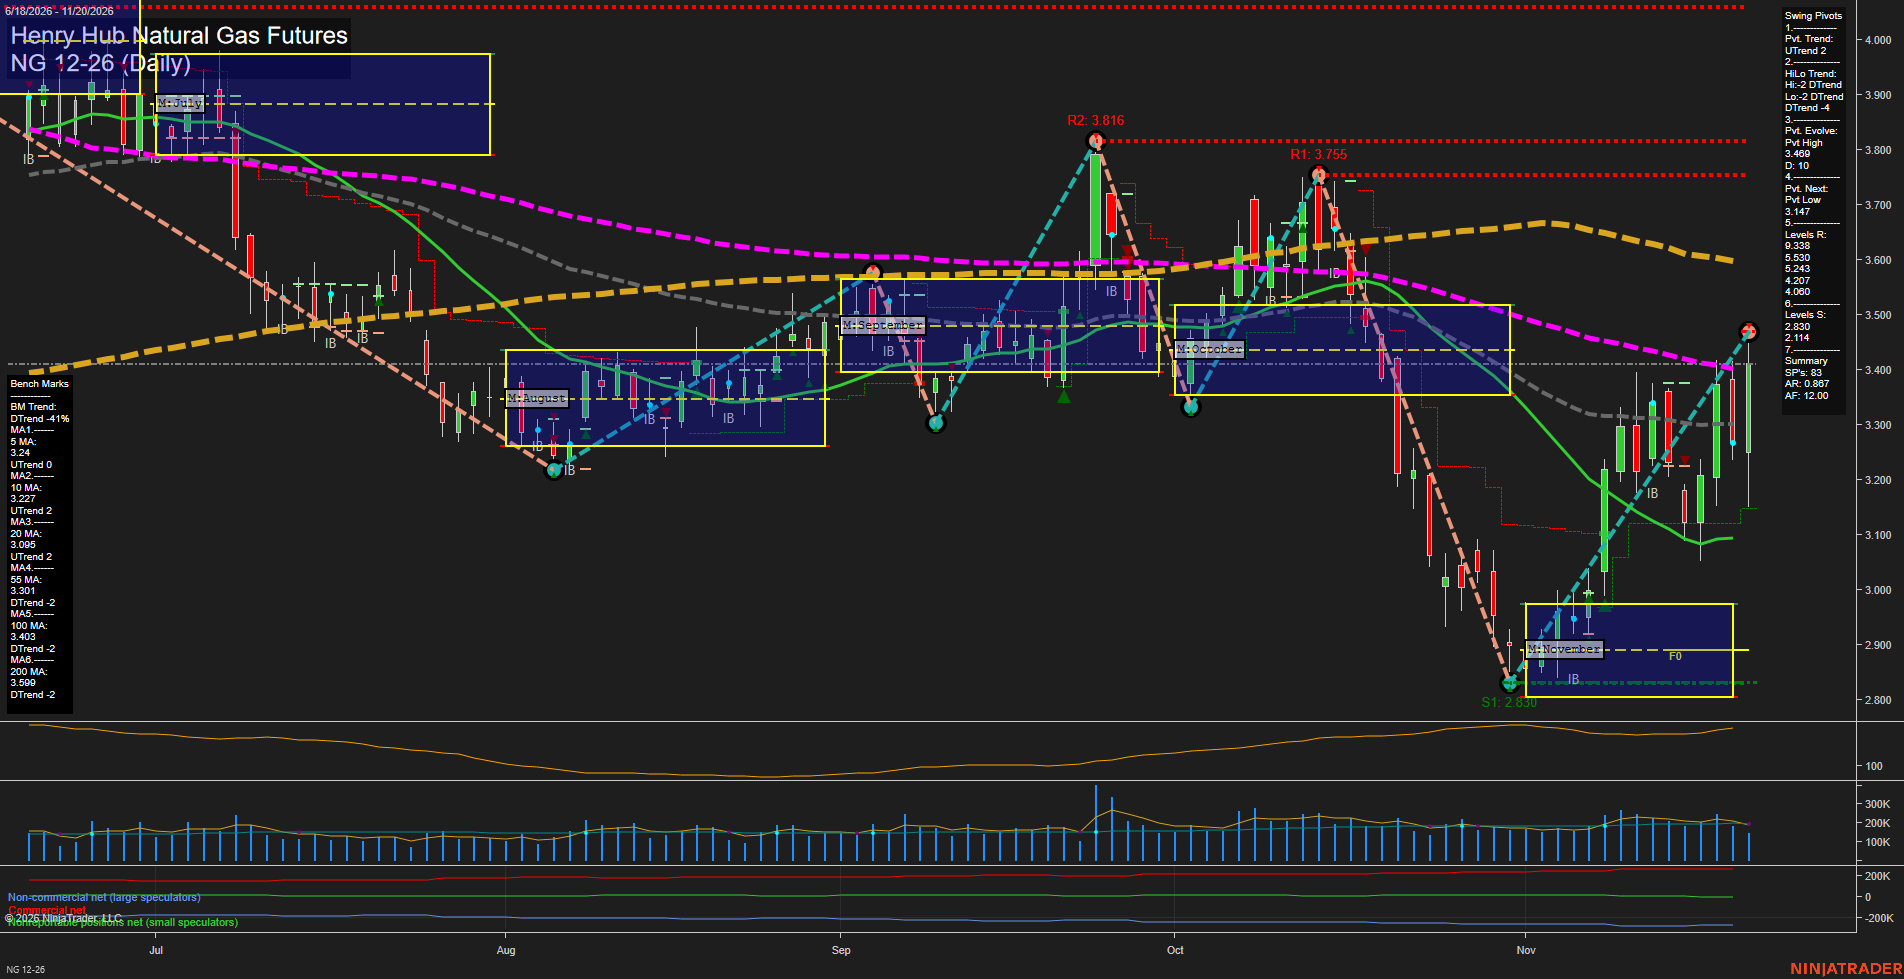
NG Henry Hub Natural Gas Futures Daily Chart Analysis — Pre-Open: 2026-Nov-21 07:09 CT
Price Action
- Last: approximately 3.410,
- Bars: Large,
- Mom: Momentum fast.
WSFG Weekly
- Near-Term
- WSFG Current: 94%
- F0%/NTZ' Bias: Price Above,
- WSFG Trend: Up.
MSFG Month Nov
- Medium-Term
- MSFG Current: 109%
- F0%/NTZ' Bias: Price Above,
- MSFG Trend: Up.
YSFG Year 2026
- Far-Term
- YSFG Current: 15%
- F0%/NTZ' Bias: Price Above,
- YSFG Trend: Up.
Swing Pivots
- (Near-Term) 1. Pvt. Trend: UTrend,
- (Medium-Term) 2. HiLo Trend: DTrend,
- 3. Pvt. Evolve: Pvt high 3.469,
- 4. Pvt. Next: Pvt low 3.147,
- 5. Levels R: 9.338, 5.530, 5.243, 4.207, 4.060,
- 6. Levels S: 2.830, 2.114.
Daily Benchmarks
- (Near-Term) 5 Day: 3.240 Up Trend,
- (Near-Term) 10 Day: 3.227 Up Trend,
- (Medium-Term) 20 Day: 3.095 Up Trend,
- (Medium-Term) 55 Day: 3.301 Down Trend,
- (Far-Term) 100 Day: 3.403 Down Trend,
- (Far-Term) 200 Day: 3.599 Down Trend.
Additional Metrics
Recent Trade Signals
- 20 Nov 2026: Long NG 12-26 @ 3.307 Signals.USAR.TR120
- 20 Nov 2026: Long NG 12-26 @ 3.219 Signals.USAR-WSFG
Overall Rating
- Near-Term: Bullish,
- Medium-Term: Neutral,
- Far-Term: Bearish.
Key Insights Summary
The November rebound from 2.830 has developed into a forceful recovery, with price above rising short-term benchmarks and the monthly neutral zone. Both recent long signals reinforce the bullish near-term alignment. Price is also above the declining 55-day average and approximately testing the 100-day average, but the medium-term lower-high/lower-low pivot structure remains intact. The evolving high at 3.469 and visible prior swing highs at 3.755 and 3.816 frame the overhead chart structure; these differ from the resistance levels reported in the pivot summary. The 3.147 reversal threshold defines the next downside pivot transition. Large daily ranges and elevated ATR characterize an energetic but uneven rebound rather than a confirmed broad trend reversal. Winter heating season provides a relevant seasonal backdrop, although the chart alone cannot establish weather, storage, or news catalysts. Declining 100-day and 200-day benchmarks keep the far-term assessment bearish despite the positive yearly grid.
Chart Analysis ATS AI Generated: 2026-11-21 07:09 for Informational use only, not trading advice. Terms and Risk Disclosure Copyright © 2026. Algo Trading Systems LLC.