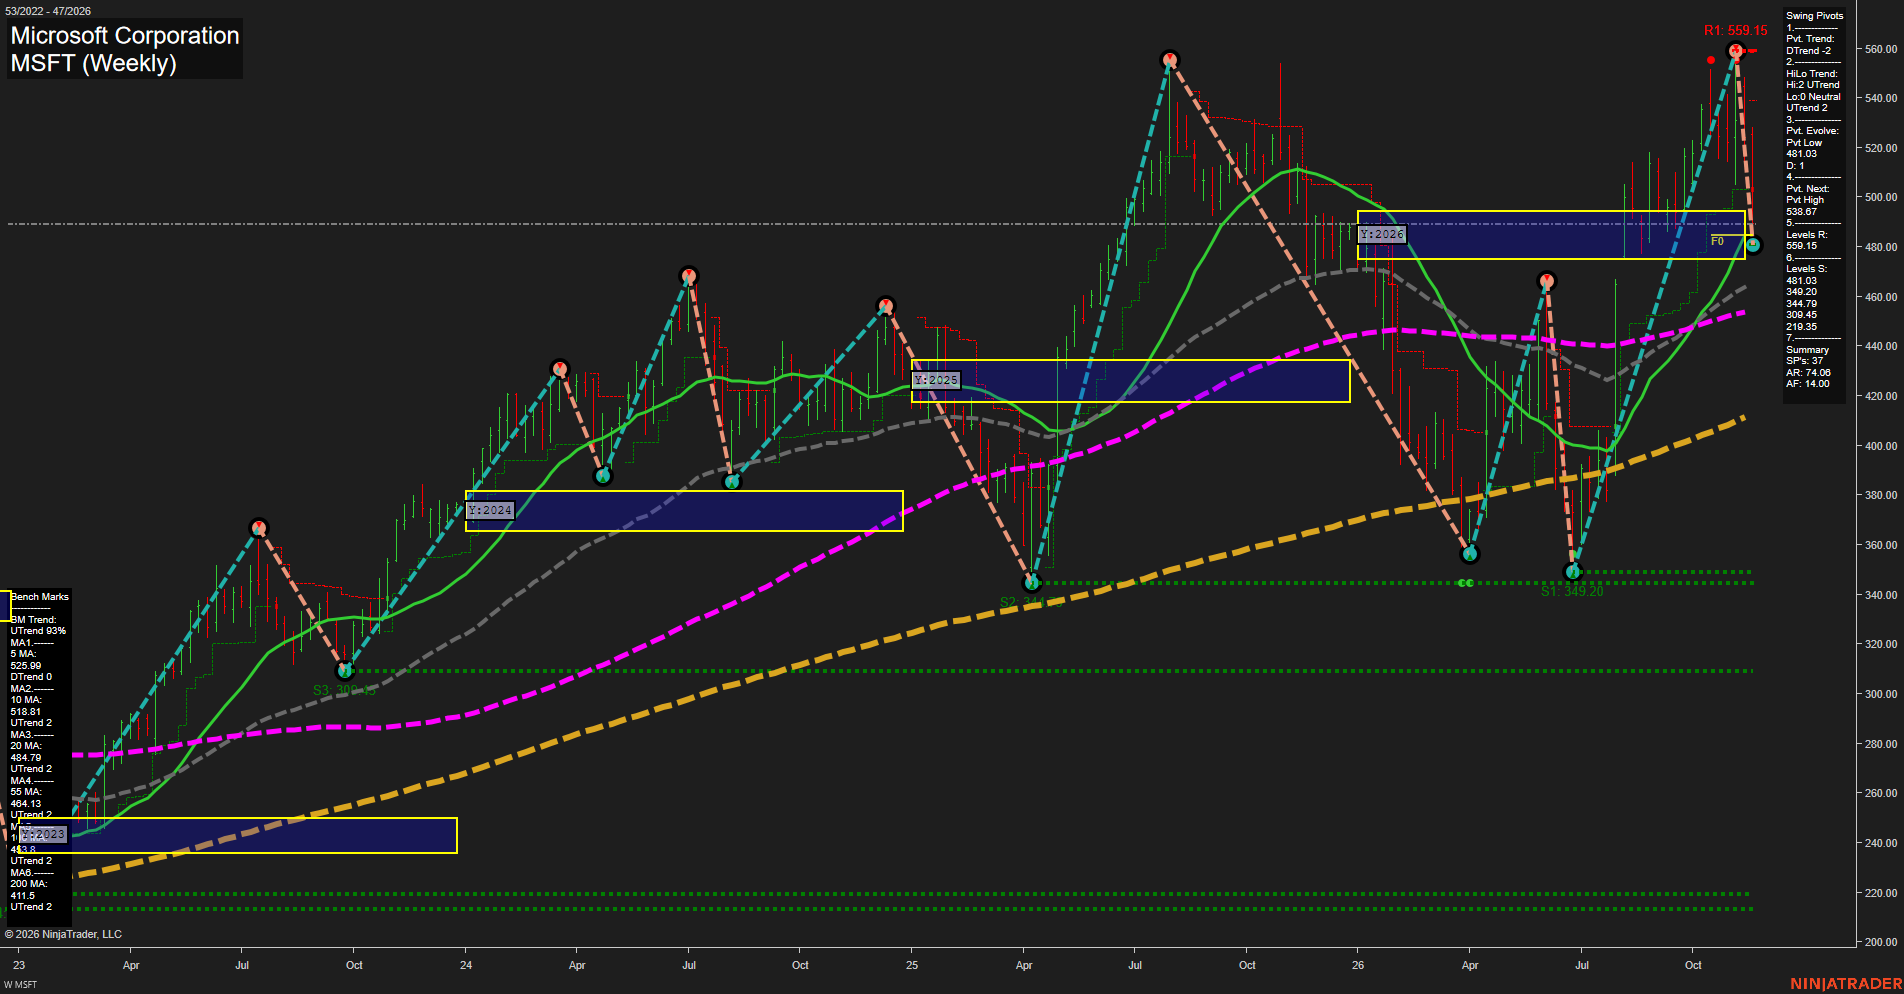
MSFT Microsoft Corporation Weekly Chart Analysis — Pre-Open: 2026-Nov-21 07:08 CT
Price Action
- Last: approximately 481,
- Bars: Large,
- Mom: Momentum fast to the downside.
WSFG Weekly
- Near-Term
- WSFG Current: NA%
- F0%/NTZ' Bias: Price Neutral,
- WSFG Trend: Neutral.
MSFG Month Nov
- Medium-Term
- MSFG Current: NA%
- F0%/NTZ' Bias: Price Neutral,
- MSFG Trend: Neutral.
YSFG Year 2026
- Far-Term
- YSFG Current: NA%
- F0%/NTZ' Bias: Price Neutral,
- YSFG Trend: Neutral.
Swing Pivots
- (Near-Term) 1. Pvt. Trend: DTrend,
- (Medium-Term) 2. HiLo Trend: UTrend,
- 3. Pvt. Evolve: Pvt low 481.03,
- 4. Pvt. Next: Pvt high 538.67,
- 5. Levels R: 559.15,
- 6. Levels S: 481.03, 349.20, 344.79, 309.45, 219.35.
Weekly Benchmarks
- (Near-Term) 5 Week: 525.99 Down Trend,
- (Near-Term) 10 Week: 518.81 Up Trend,
- (Medium-Term) 20 Week: 484.79 Up Trend,
- (Medium-Term) 55 Week: 464.13 Up Trend,
- (Far-Term) 100 Week: approximately 453.8 Up Trend,
- (Far-Term) 200 Week: 411.5 Up Trend.
Overall Rating
- Near-Term: Bearish,
- Medium-Term: Bullish,
- Far-Term: Bullish.
Key Insights Summary
From a futures swing trader’s perspective, the defining feature is a fast countertrend downswing within a broader rising structure. Price has reversed approximately 14% from 559.15, fallen below both near-term benchmarks, and slipped beneath the rising 20-week average. The evolving 481.03 pivot low lies inside the approximately 475–495 yearly neutral zone, below its center line: the prior breakout has retraced into balance rather than established sustained acceptance above it. Medium-term structure remains bullish in the pivot summary, although its low-pivot component is neutral. Rising 55-, 100-, and 200-week benchmarks preserve the broader bullish backdrop. The 481.03 evolving low and 464.13 benchmark define nearby structural references; overhead, 518.81–525.99 marks the near-term benchmark band, followed by the 538.67 next-pivot threshold and 559.15 resistance. Weekly and monthly grids and the requested recent signal indicators are not displayed, so their direction cannot be independently verified. News catalysts and seasonal effects cannot be established from this chart alone.
Chart Analysis ATS AI Generated: 2026-11-21 07:09 for Informational use only, not trading advice. Terms and Risk Disclosure Copyright © 2026. Algo Trading Systems LLC.