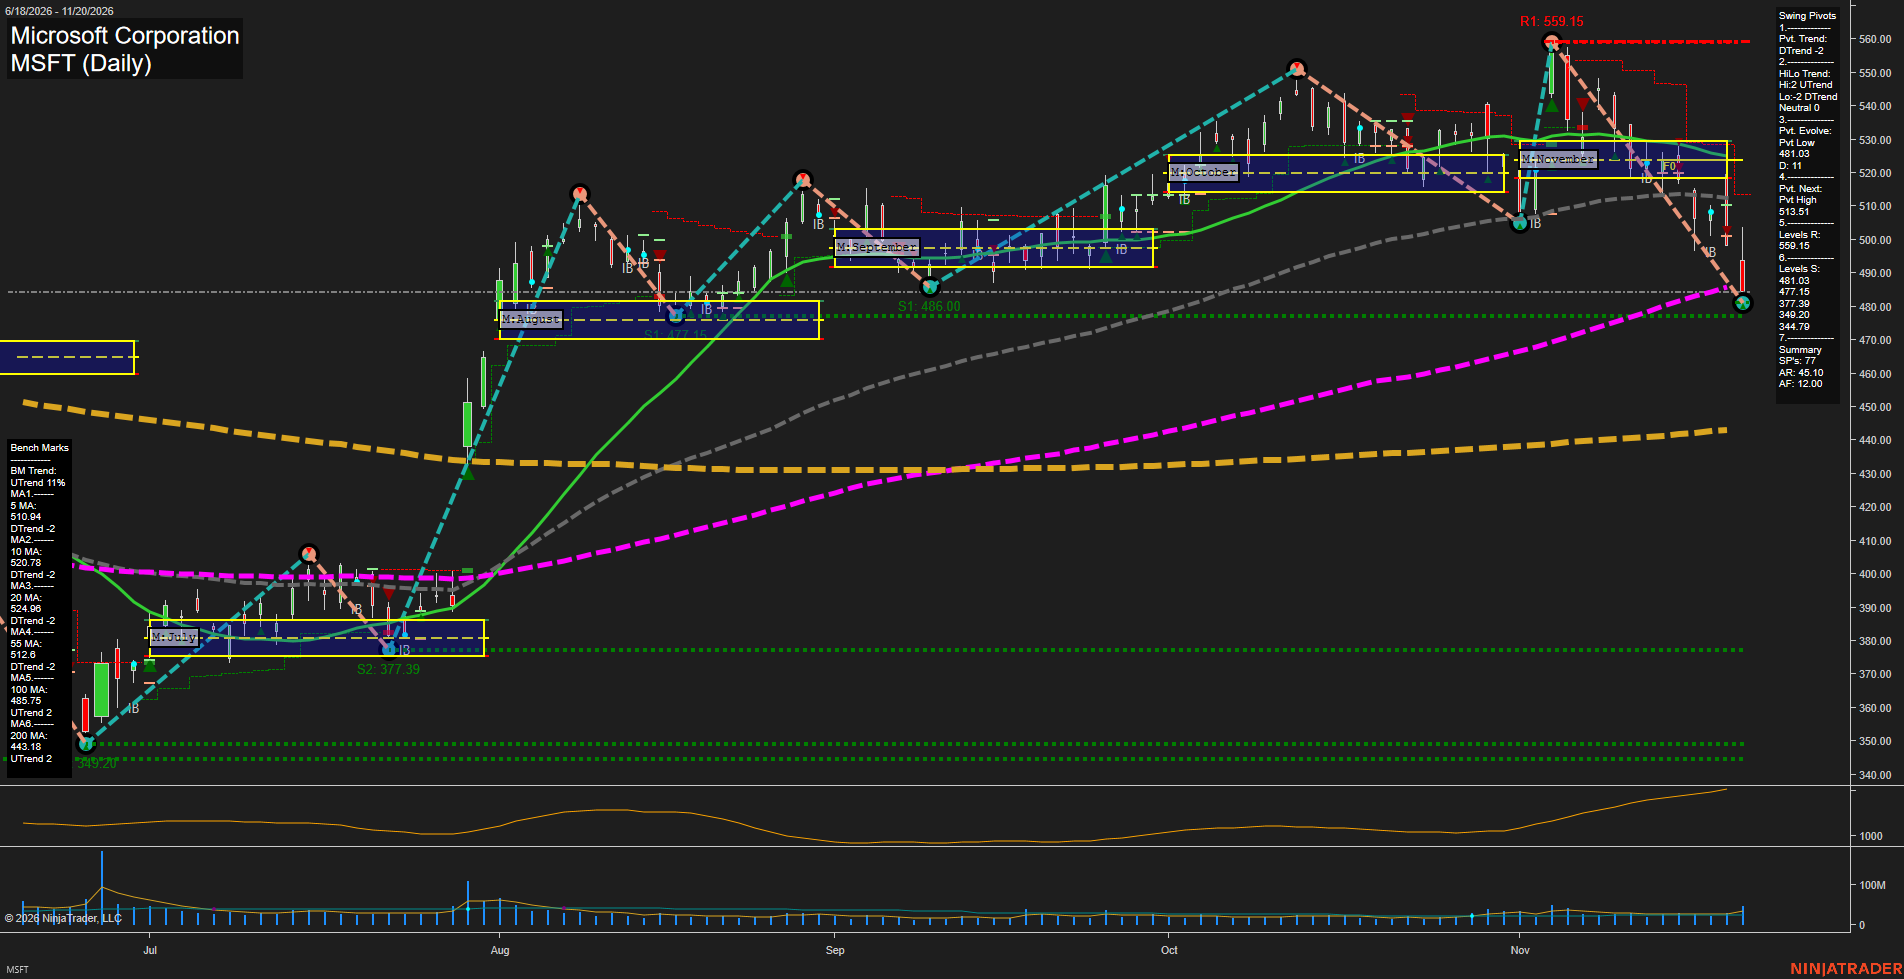
MSFT Microsoft Corporation Daily Chart Analysis — Pre-Open: 2026-Nov-21 07:08 CT
Price Action
- Last: Approximately 484,
- Bars: Large,
- Mom: Momentum fast.
WSFG Weekly
- Near-Term
- WSFG Current: NA%
- F0%/NTZ' Bias: Price Neutral,
- WSFG Trend: Neutral.
MSFG Month Nov
- Medium-Term
- MSFG Current: NA%
- F0%/NTZ' Bias: Price Bearish,
- MSFG Trend: Bearish.
YSFG Year 2026
- Far-Term
- YSFG Current: NA%
- F0%/NTZ' Bias: Price Neutral,
- YSFG Trend: Neutral.
Swing Pivots
- (Near-Term) 1. Pvt. Trend: DTrend,
- (Medium-Term) 2. HiLo Trend: Neutral,
- 3. Pvt. Evolve: Pvt low 481.03,
- 4. Pvt. Next: Pvt high 513.51,
- 5. Levels R: 559.15,
- 6. Levels S: 481.03, 477.15, 377.39, 349.20, 344.79.
Daily Benchmarks
- (Near-Term) 5 Day: 510.94 Down Trend,
- (Near-Term) 10 Day: 520.78 Down Trend,
- (Medium-Term) 20 Day: 524.96 Down Trend,
- (Medium-Term) 55 Day: 512.60 Down Trend,
- (Far-Term) 100 Day: 485.75 Up Trend,
- (Far-Term) 200 Day: 443.18 Up Trend.
Additional Metrics
- ATR: 791,
- VOLMA: 26357793.
Overall Rating
- Near-Term: Bearish,
- Medium-Term: Bearish,
- Far-Term: Bullish.
Key Insights Summary
From a futures swing trader’s perspective, MSFT shows an accelerating downside swing within a still-rising longer-term benchmark structure. The decline from 559.15 has reached approximately 484, placing price below the November neutral zone near 518–529 and marginally beneath the rising 100-day benchmark. Large recent bearish candles and an expanding ATR plot indicate increasing daily range and downside momentum. Support is concentrated at 481.03–477.15; the next listed support below that cluster is substantially lower at 377.39. The pivot summary remains mixed over the medium term, with rising highs offset by falling lows, while the near-term pivot trend is down. The 513.51 next-pivot threshold and declining 5–55-day benchmarks define overhead technical references. The far-term bullish rating reflects rising 100- and 200-day benchmarks rather than bullish current price momentum. This is an equity chart, not a futures contract chart; weekly/yearly grids, named strategy signals, and news catalysts are not available for confirmation.
Chart Analysis ATS AI Generated: 2026-11-21 07:08 for Informational use only, not trading advice. Terms and Risk Disclosure Copyright © 2026. Algo Trading Systems LLC.