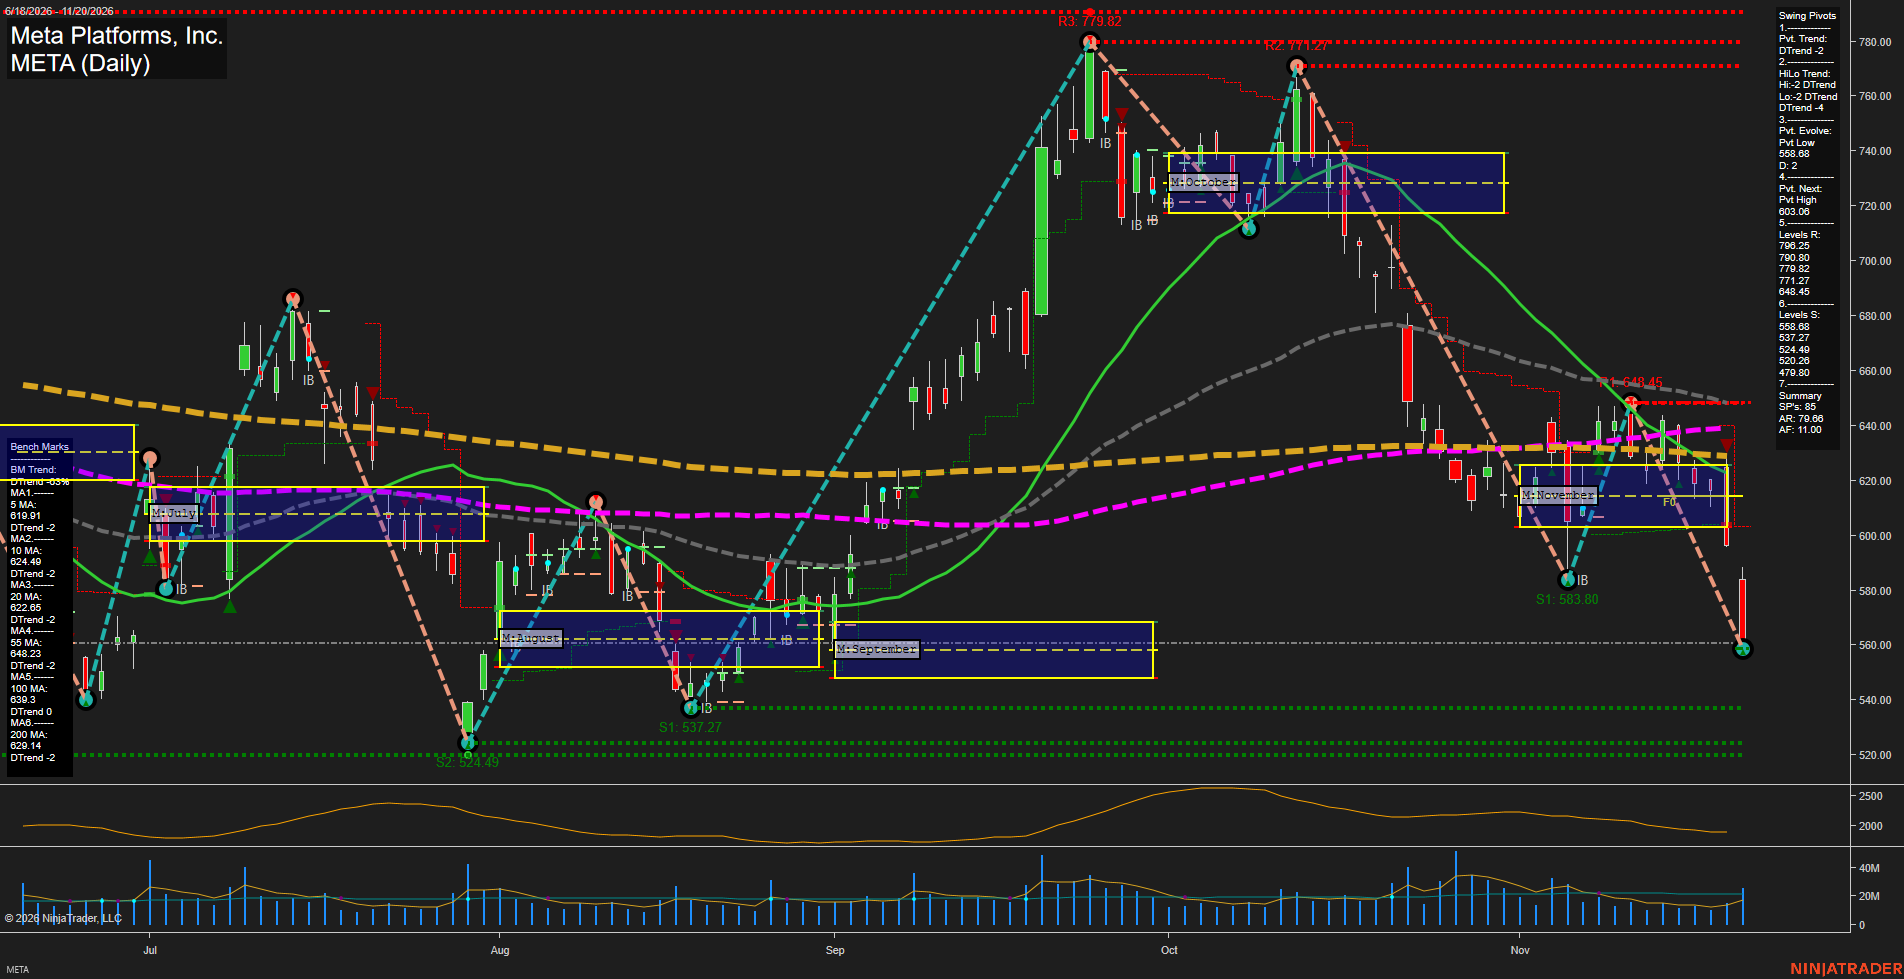
META Meta Platforms; Inc. Daily Chart Analysis — Pre-Open: 2026-Nov-21 07:08 CT
Price Action
- Last: approximately 558.68,
- Bars: Large,
- Mom: Momentum fast.
WSFG Weekly
- Near-Term
- WSFG Current: NA%
- F0%/NTZ' Bias: Price Neutral,
- WSFG Trend: Neutral.
MSFG Month Nov
- Medium-Term
- MSFG Current: NA%
- F0%/NTZ' Bias: Price Below F0% and NTZ,
- MSFG Trend: Bearish.
YSFG Year 2026
- Far-Term
- YSFG Current: NA%
- F0%/NTZ' Bias: Price Neutral,
- YSFG Trend: Neutral.
Swing Pivots
- (Near-Term) 1. Pvt. Trend: DTrend,
- (Medium-Term) 2. HiLo Trend: DTrend,
- 3. Pvt. Evolve: Pvt low 558.68,
- 4. Pvt. Next: Pvt high 603.06,
- 5. Levels R: 796.25, 790.80, 779.82, 771.27, 648.45,
- 6. Levels S: 558.68, 537.27, 524.49, 520.26, 479.80.
Daily Benchmarks
- (Near-Term) 5 Day: 619.91 Down Trend,
- (Near-Term) 10 Day: 624.49 Down Trend,
- (Medium-Term) 20 Day: 622.65 Down Trend,
- (Medium-Term) 55 Day: 648.23 Down Trend,
- (Far-Term) 100 Day: 639.30 Down Trend,
- (Far-Term) 200 Day: 629.14 Down Trend.
Additional Metrics
- ATR: 2162,
- VOLMA: 26211336.
Overall Rating
- Near-Term: Bearish,
- Medium-Term: Bearish,
- Far-Term: Bearish.
Key Insights Summary
From a futures swing trader’s perspective, the dominant feature is downside range expansion following a failed recovery to 648.45. Lower swing highs and lows, declining benchmarks, and a decisive break beneath November’s neutral zone identify bearish continuation rather than balanced consolidation. Price has also broken the prior 583.80 swing low and is testing the evolving 558.68 pivot, with lower recorded supports at 537.27 and 524.49. The 603.06 next-pivot threshold marks the chart’s near-term reversal reference, not a confirmed reversal. Price is substantially below every benchmark, showing both strong downside displacement and an extended decline. Weekly and yearly grids and the named signal-series readings are not visible; their neutral placeholders do not establish balanced conditions. News and seasonal drivers cannot be verified from this chart. META is an equity chart, so this assessment applies a futures-style price-structure framework rather than contract-specific futures analysis.
Chart Analysis ATS AI Generated: 2026-11-21 07:08 for Informational use only, not trading advice. Terms and Risk Disclosure Copyright © 2026. Algo Trading Systems LLC.