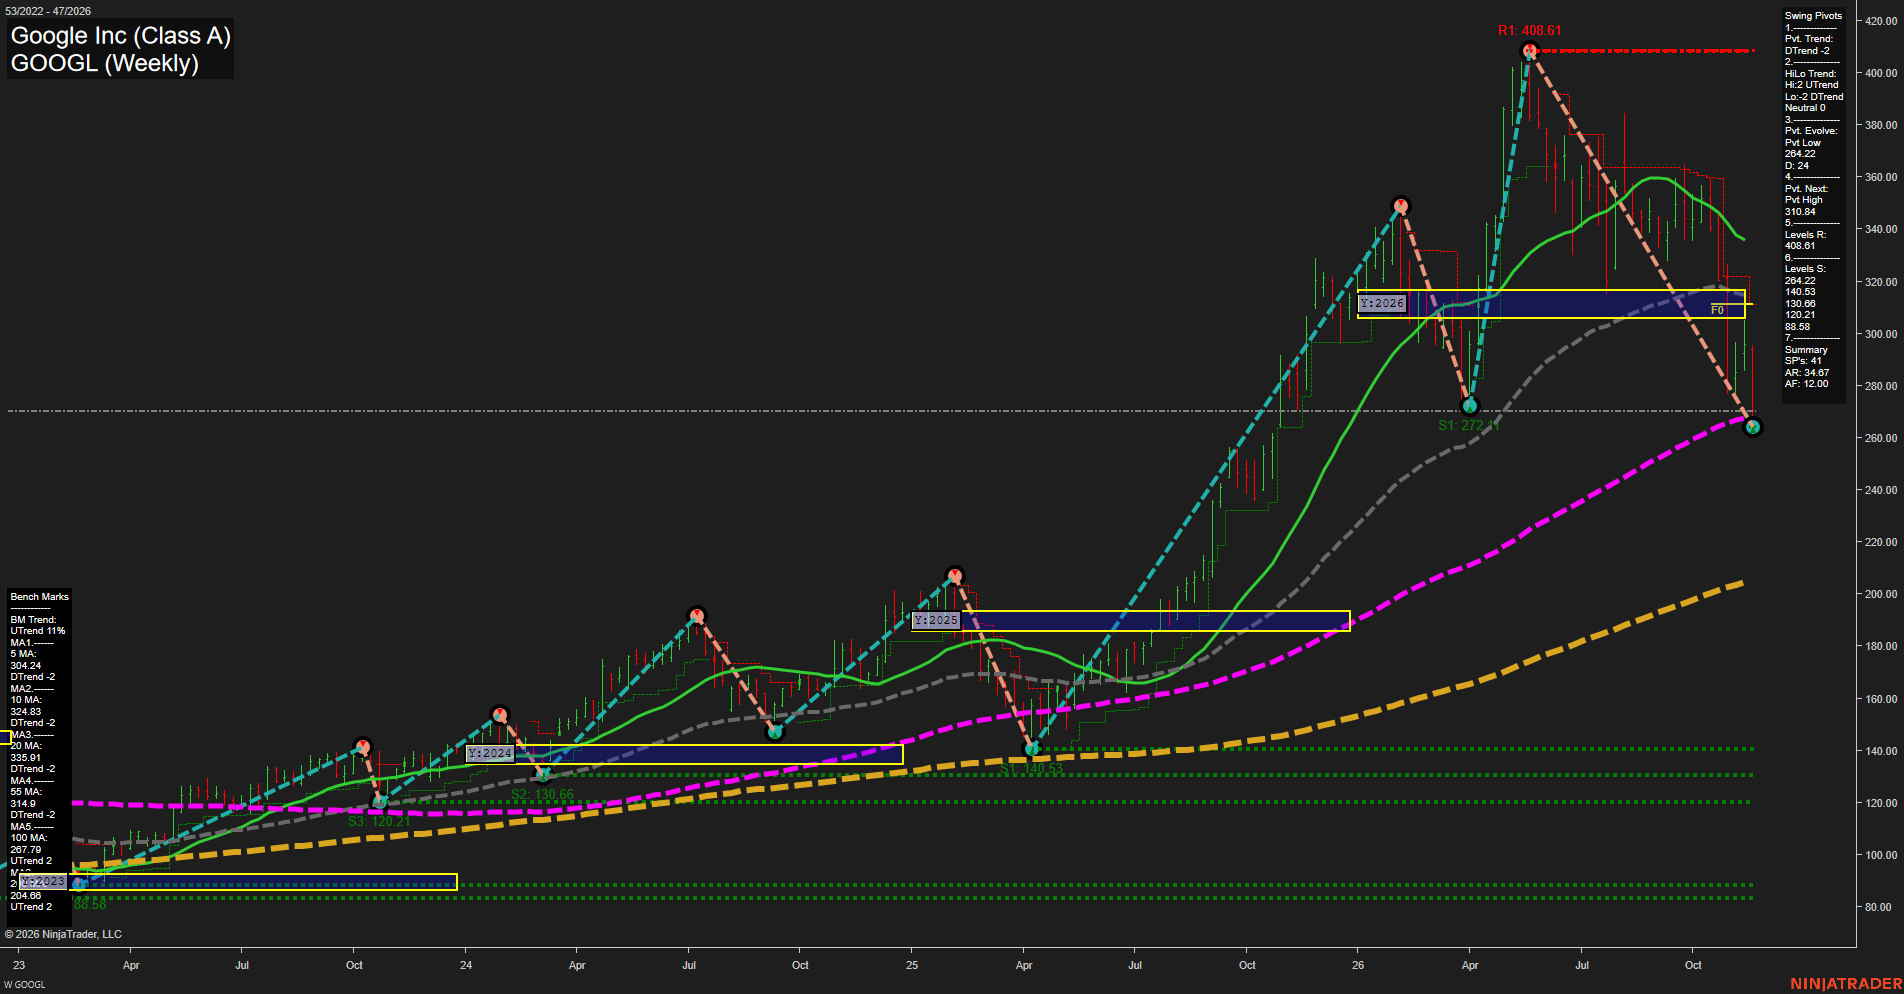
GOOGL Google Inc (Class A) Weekly Chart Analysis — Pre-Open: 2026-Nov-21 07:08 CT
Price Action
- Last: approximately 264.22,
- Bars: Large,
- Mom: Momentum fast to the downside.
WSFG Weekly
- Near-Term
- WSFG Current: NA%
- F0%/NTZ' Bias: Price Neutral,
- WSFG Trend: Neutral.
MSFG Month Nov
- Medium-Term
- MSFG Current: NA%
- F0%/NTZ' Bias: Price Neutral,
- MSFG Trend: Neutral.
YSFG Year 2026
- Far-Term
- YSFG Current: NA%
- F0%/NTZ' Bias: Price Below NTZ,
- YSFG Trend: Bearish.
Swing Pivots
- (Near-Term) 1. Pvt. Trend: DTrend,
- (Medium-Term) 2. HiLo Trend: Neutral,
- 3. Pvt. Evolve: Pvt low 264.22,
- 4. Pvt. Next: Pvt high 310.84,
- 5. Levels R: 408.61,
- 6. Levels S: 264.22, 140.53, 130.66, 120.21, 88.58.
Weekly Benchmarks
- (Near-Term) 5 Week: 304.24 Down Trend,
- (Near-Term) 10 Week: 324.83 Down Trend,
- (Medium-Term) 20 Week: 335.91 Down Trend,
- (Medium-Term) 55 Week: 314.90 Down Trend,
- (Far-Term) 100 Week: 267.79 Up Trend,
- (Far-Term) 200 Week: 204.66 Up Trend.
Overall Rating
- Near-Term: Bearish,
- Medium-Term: Bearish,
- Far-Term: Bullish.
Key Insights Summary
From a futures swing trader’s perspective, this equity chart shows downside expansion within a still-rising long-term benchmark structure. The decline from 408.61 to approximately 264.22 is roughly 35%, with price under all benchmarks except the 200-week average. The break beneath the prior 272.11 swing low and the 100-week average reflects weakening structure rather than a confirmed recovery. The evolving 264.22 pivot is not yet a confirmed bottom; the summary identifies 310.84 as the next opposite-pivot reversal level. The yearly neutral zone around 306–317 now sits overhead. Medium-term HiLo structure is explicitly Neutral, combining higher highs with lower lows, but declining 20- and 55-week averages give the medium-term balance a bearish tilt. The far-term bullish rating rests on rising 100- and 200-week averages, although the bearish yearly-grid position shows substantial deterioration. Weekly and monthly grids and the named recent trade signals are not displayed, so their directional confirmation is unavailable. News and seasonal drivers cannot be established from this chart alone.
Chart Analysis ATS AI Generated: 2026-11-21 07:08 for Informational use only, not trading advice. Terms and Risk Disclosure Copyright © 2026. Algo Trading Systems LLC.