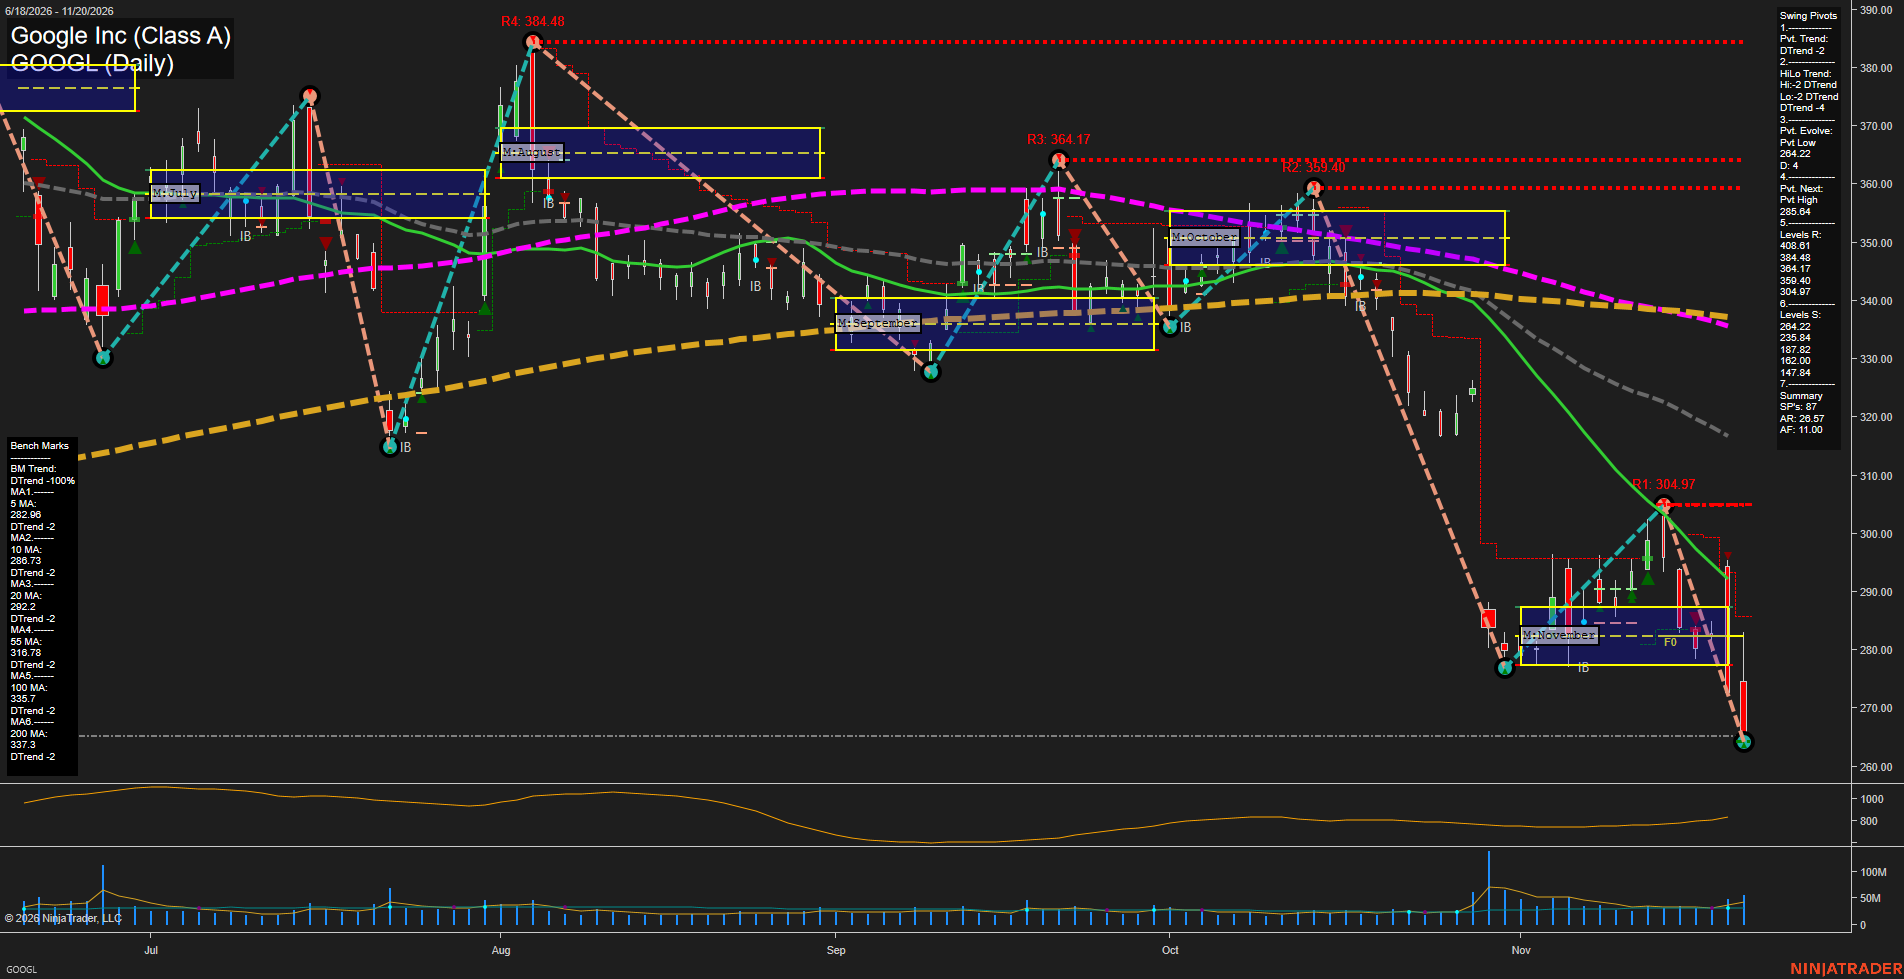
GOOGL Google Inc (Class A) Daily Chart Analysis — Pre-Open: 2026-Nov-21 07:07 CT
Price Action
- Last: Approximately 265.00,
- Bars: Large,
- Mom: Momentum fast.
WSFG Weekly
- Near-Term
- WSFG Current: NA%
- F0%/NTZ' Bias: Price Neutral,
- WSFG Trend: Neutral.
MSFG Month Nov
- Medium-Term
- MSFG Current: Below NTZ
- F0%/NTZ' Bias: Price Bearish,
- MSFG Trend: Bearish.
YSFG Year 2026
- Far-Term
- YSFG Current: NA%
- F0%/NTZ' Bias: Price Neutral,
- YSFG Trend: Neutral.
Swing Pivots
- (Near-Term) 1. Pvt. Trend: DTrend,
- (Medium-Term) 2. HiLo Trend: DTrend,
- 3. Pvt. Evolve: Pvt low 264.22,
- 4. Pvt. Next: Pvt high 285.64,
- 5. Levels R: 408.61, 384.48, 364.17, 359.40, 304.97,
- 6. Levels S: 264.22, 235.84, 187.82, 162.00, 147.84.
Daily Benchmarks
- (Near-Term) 5 Day: 282.98 Down Trend,
- (Near-Term) 10 Day: 286.73 Down Trend,
- (Medium-Term) 20 Day: 292.20 Down Trend,
- (Medium-Term) 55 Day: 316.78 Down Trend,
- (Far-Term) 100 Day: 335.70 Down Trend,
- (Far-Term) 200 Day: 337.03 Down Trend.
Additional Metrics
- ATR: 420,
- VOLMA: 25379774.
Overall Rating
- Near-Term: Bearish,
- Medium-Term: Bearish,
- Far-Term: Bearish.
Key Insights Summary
From a futures swing trader’s perspective, the dominant feature is downside trend alignment across all six benchmarks, with price below every average and both pivot trends declining. The rebound to 304.97 established a lower high before a renewed selloff broke the November balance area near 278–287 and extended to an evolving 264.22 pivot low. This resembles bearish trend continuation following a countertrend rally rather than a confirmed base. Large recent candles indicate forceful downside momentum; 285.64 is the summary’s next opposite-pivot reversal threshold, not an established reversal. Weekly and yearly grids and the named strategy signals are not readable, so their neutral entries represent unavailable evidence rather than confirmed balance. ATR and VOLMA values above are supplied template inputs, not independently verified chart readings. The image alone does not establish news or seasonal drivers, and this is an equity chart rather than a futures contract.
Chart Analysis ATS AI Generated: 2026-11-21 07:08 for Informational use only, not trading advice. Terms and Risk Disclosure Copyright © 2026. Algo Trading Systems LLC.