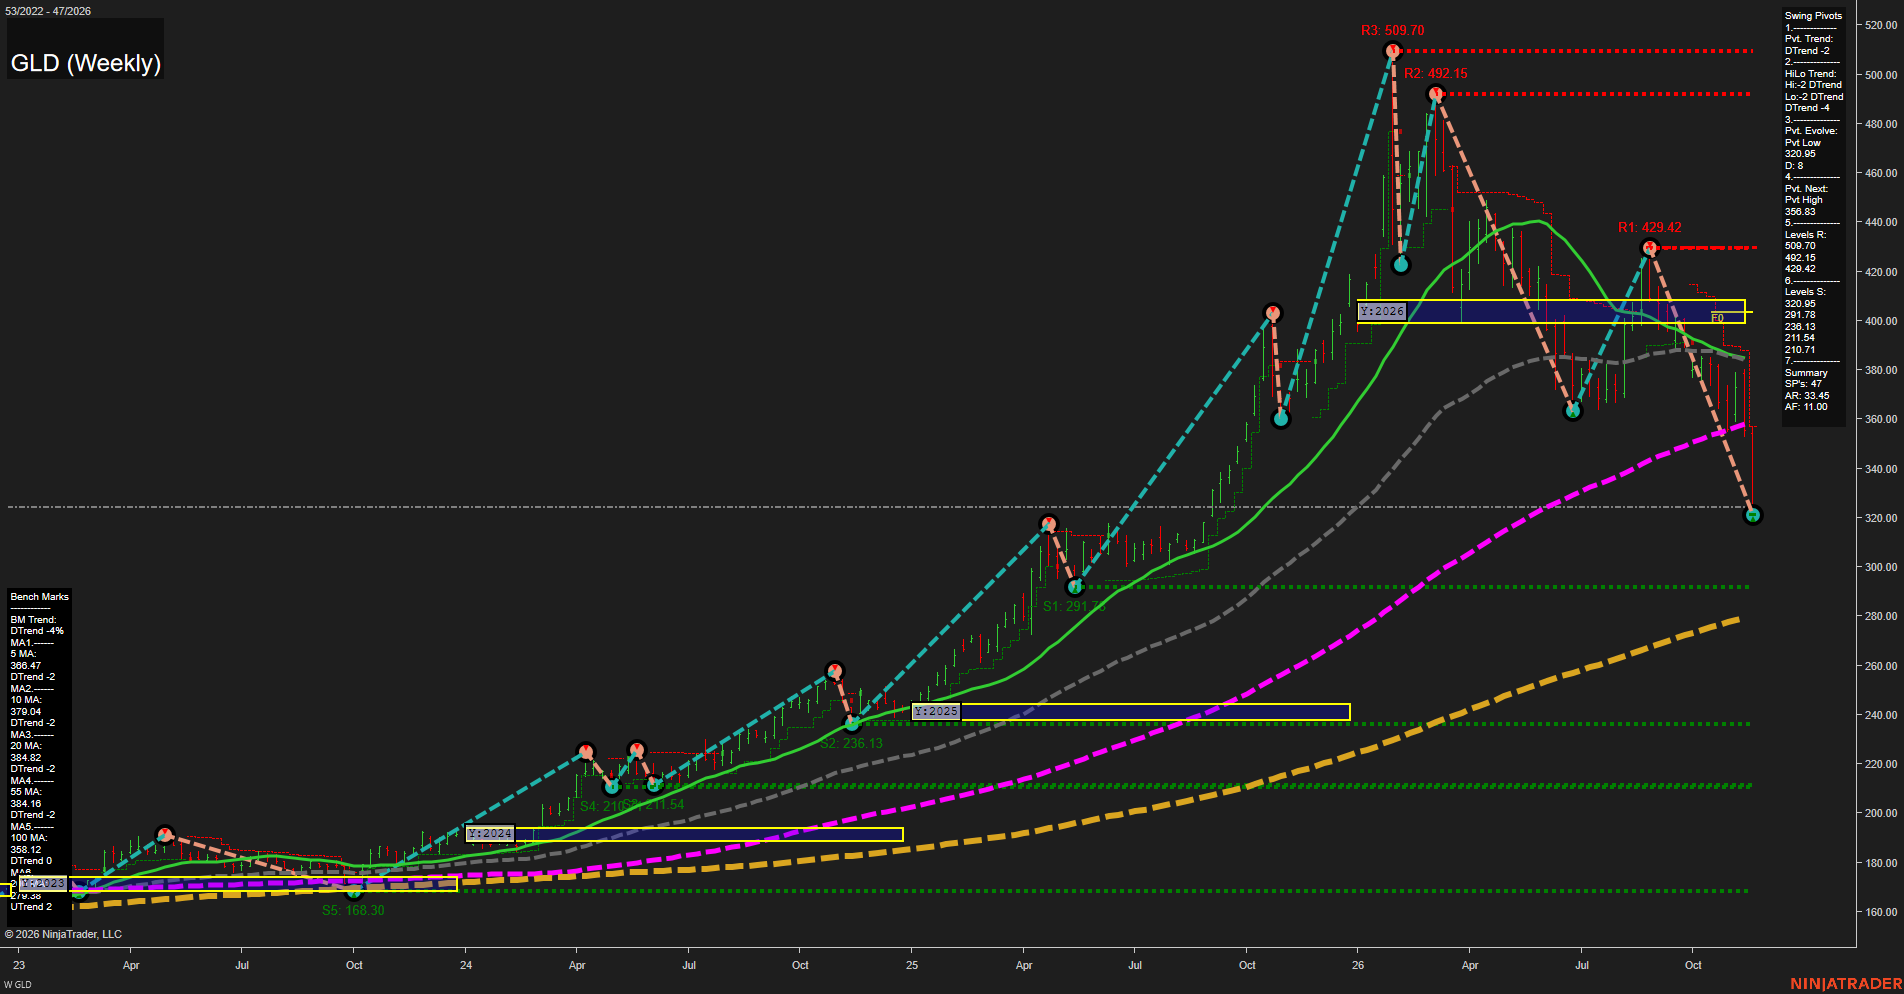
GLD SPDR Gold Shares Weekly Chart Analysis — Pre-Open: 2026-Nov-21 07:07 CT
Price Action
- Last: Approximately 324,
- Bars: Large,
- Mom: Momentum fast to the downside.
WSFG Weekly
- Near-Term
- WSFG Current: NA%
- F0%/NTZ' Bias: Price Neutral,
- WSFG Trend: Neutral.
MSFG Month Nov
- Medium-Term
- MSFG Current: NA%
- F0%/NTZ' Bias: Price Neutral,
- MSFG Trend: Neutral.
YSFG Year 2026
- Far-Term
- YSFG Current: NA%
- F0%/NTZ' Bias: Price Neutral,
- YSFG Trend: Neutral.
Swing Pivots
- (Near-Term) 1. Pvt. Trend: DTrend,
- (Medium-Term) 2. HiLo Trend: DTrend,
- 3. Pvt. Evolve: Pvt low 320.95,
- 4. Pvt. Next: Pvt high 356.83,
- 5. Levels R: 509.70, 492.15, 429.42,
- 6. Levels S: 320.95, 291.78, 236.13, 211.54, 210.71.
Weekly Benchmarks
- (Near-Term) 5 Week: 366.47 Down Trend,
- (Near-Term) 10 Week: 379.04 Down Trend,
- (Medium-Term) 20 Week: 384.82 Down Trend,
- (Medium-Term) 55 Week: 384.16 Down Trend,
- (Far-Term) 100 Week: 358.12 Down Trend,
- (Far-Term) 200 Week: Approximately 278.6 Up Trend.
Overall Rating
- Near-Term: Bearish,
- Medium-Term: Bearish,
- Far-Term: Neutral.
Key Insights Summary
From a futures swing trader’s perspective, this gold proxy shows an accelerating weekly downswing rather than a routine consolidation. Successively lower resistance peaks at 509.70, 492.15 and 429.42 accompany deteriorating lows, confirming the bearish pivot structure. Price is below the 5-, 10-, 20-, 55- and 100-week benchmarks, with the evolving low at 320.95 defining the immediate downside reference and 291.78 the next listed support. The 356.83 next-pivot threshold is a reversal reference, not an already confirmed recovery. The rising 200-week benchmark preserves some long-cycle strength, but the declining 100-week benchmark leaves the far-term picture mixed. Although the required session-grid fields are neutral placeholders, price is visibly below the 2026 yearly NTZ around 400–409, a bearish technical relationship. Weekly and monthly grids and the named recent-signal indicators are not visible, so their directional readings cannot be verified. The chart alone does not establish news or seasonal drivers, and GLD prices are not directly interchangeable with gold futures prices.
Chart Analysis ATS AI Generated: 2026-11-21 07:07 for Informational use only, not trading advice. Terms and Risk Disclosure Copyright © 2026. Algo Trading Systems LLC.