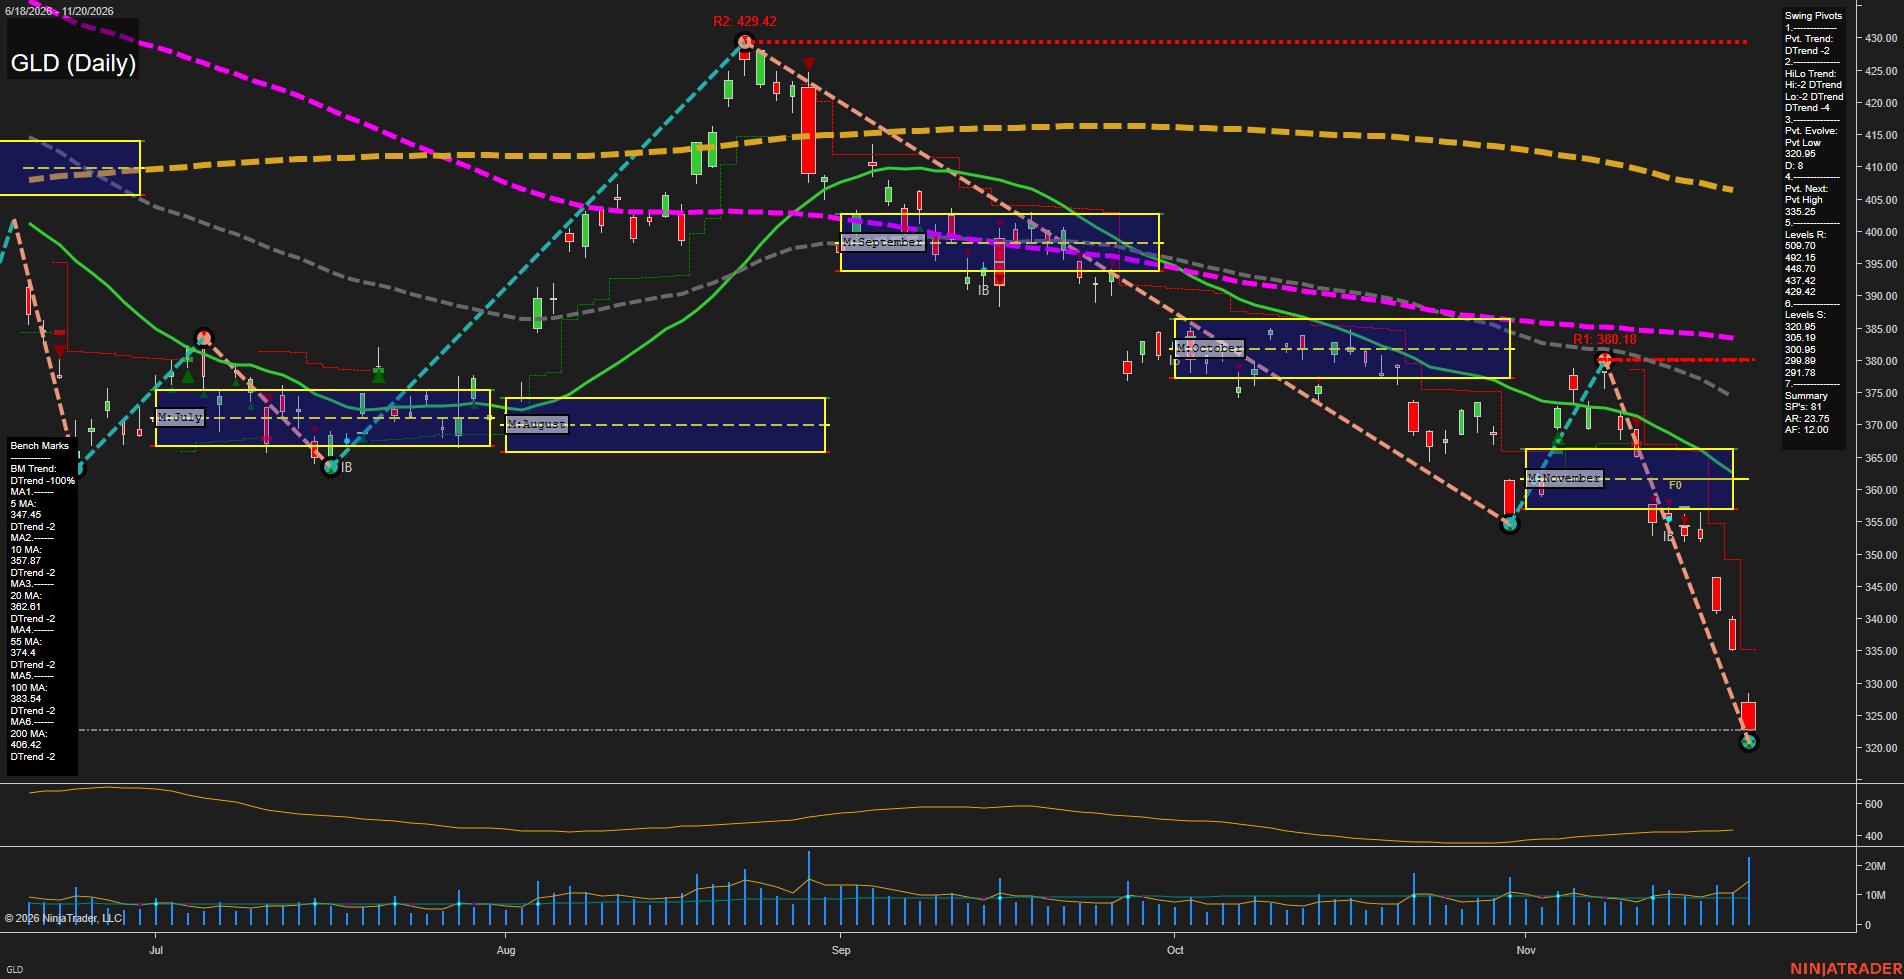
GLD SPDR Gold Shares Daily Chart Analysis — Pre-Open: 2026-Nov-21 07:07 CT
Price Action
- Last: Approximately 323,
- Bars: Large,
- Mom: Momentum fast.
WSFG Weekly
- Near-Term
- WSFG Current: NA%
- F0%/NTZ' Bias: Price Neutral,
- WSFG Trend: Neutral.
MSFG Month Nov
- Medium-Term
- MSFG Current: NA%
- F0%/NTZ' Bias: Price Below NTZ,
- MSFG Trend: Bearish.
YSFG Year 2026
- Far-Term
- YSFG Current: NA%
- F0%/NTZ' Bias: Price Neutral,
- YSFG Trend: Neutral.
Swing Pivots
- (Near-Term) 1. Pvt. Trend: DTrend,
- (Medium-Term) 2. HiLo Trend: DTrend,
- 3. Pvt. Evolve: Pvt low 320.95,
- 4. Pvt. Next: Pvt high 335.25,
- 5. Levels R: 509.70, 492.15, 448.70, 437.42, 429.42,
- 6. Levels S: 320.95, 305.19, 300.95, 299.89, 291.78.
Daily Benchmarks
- (Near-Term) 5 Day: 347.45 Down Trend,
- (Near-Term) 10 Day: 357.87 Down Trend,
- (Medium-Term) 20 Day: 362.61 Down Trend,
- (Medium-Term) 55 Day: 374.4 Down Trend,
- (Far-Term) 100 Day: 383.54 Down Trend,
- (Far-Term) 200 Day: 406.42 Down Trend.
Additional Metrics
- ATR: 159,
- VOLMA: 7207880.
Overall Rating
- Near-Term: Bearish,
- Medium-Term: Bearish,
- Far-Term: Bearish.
Key Insights Summary
From a futures swing-trading perspective, GLD shows an accelerating downside impulse within an established bearish trend, rather than an ordinary pullback. The November rebound failed near 380.18, followed by a breakdown beneath the monthly neutral zone around 357–366 and a fresh evolving low at 320.95. Lower swing highs and lows, price beneath all six declining benchmarks, and heavier volume on the latest selloff reinforce bearish alignment across time frames. The substantial separation from the 5-day average also indicates a stretched short-term decline, without confirming a reversal. The pivot summary identifies 335.25 as the next opposite-pivot reversal threshold. Weekly and yearly grids and the named strategy signals are not displayed; their neutral entries reflect unavailable evidence, not confirmed balance. News and seasonal explanations cannot be established from this chart. GLD is a gold ETF, so these price levels are not gold-futures contract levels.
Chart Analysis ATS AI Generated: 2026-11-21 07:07 for Informational use only, not trading advice. Terms and Risk Disclosure Copyright © 2026. Algo Trading Systems LLC.