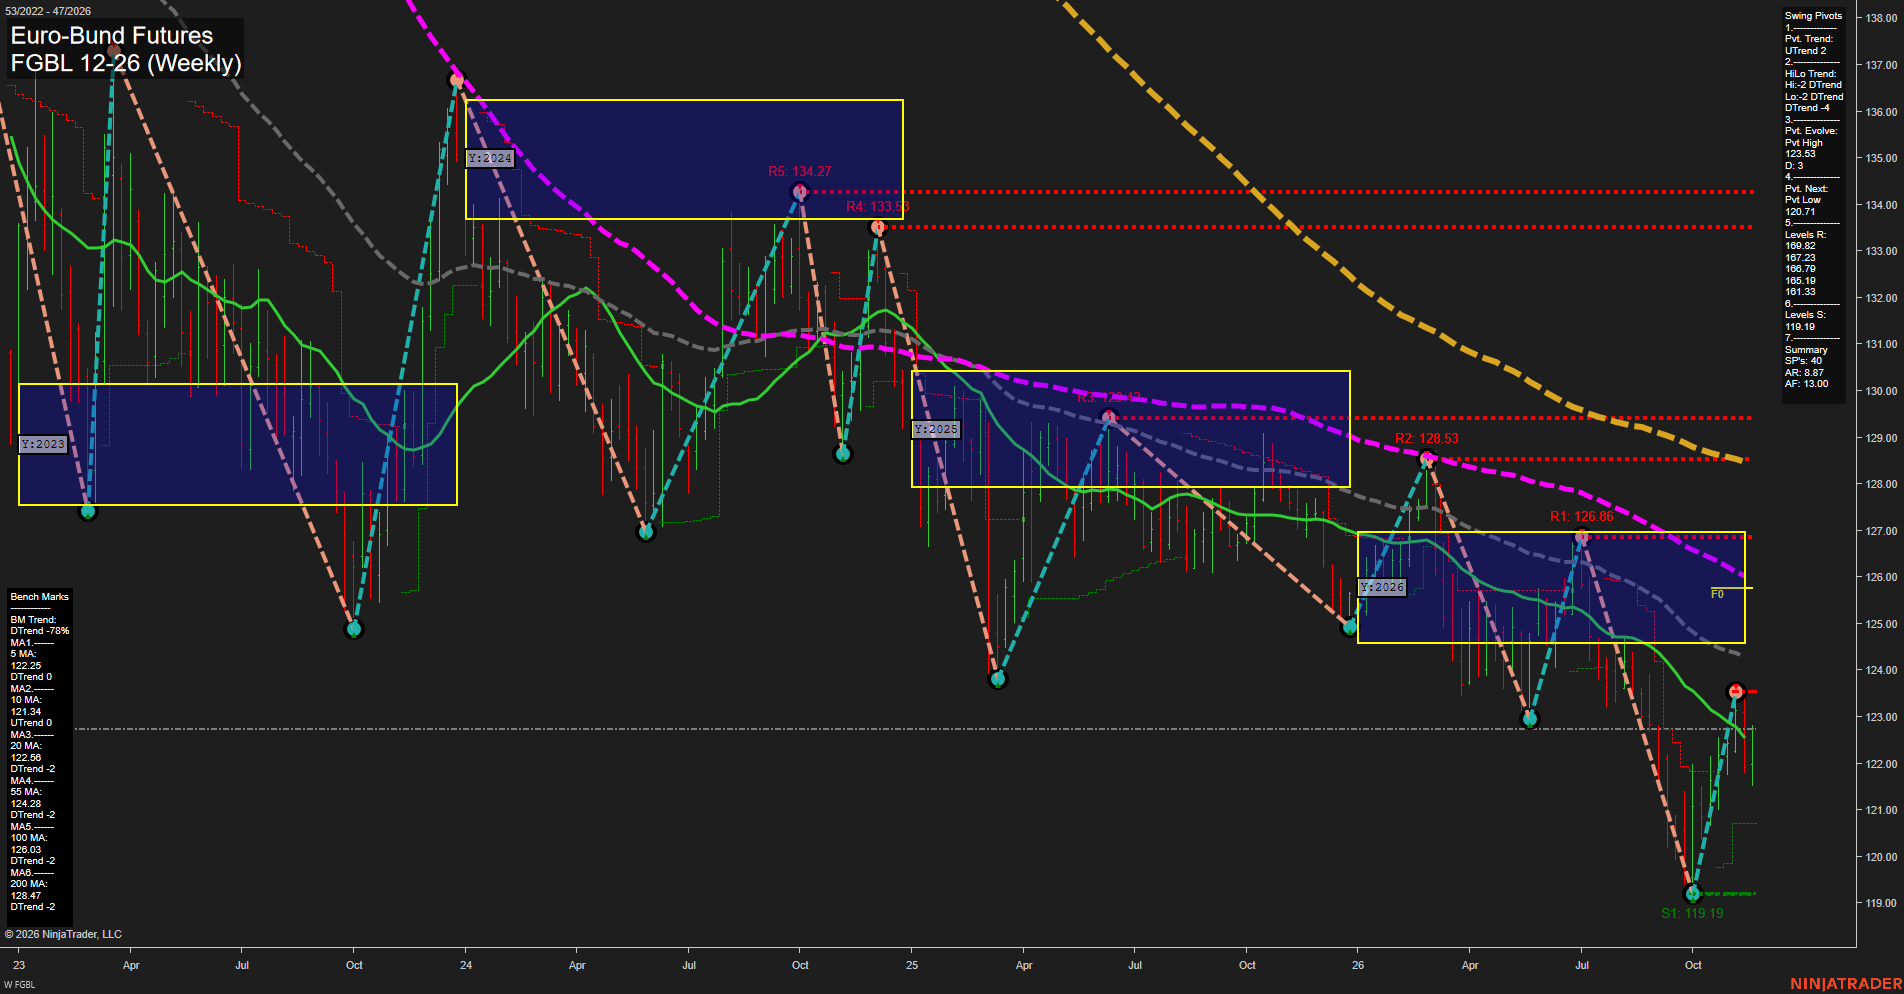
FGBL Euro-Bund Futures Weekly Chart Analysis — Pre-Open: 2026-Nov-21 07:06 CT
Price Action
- Last: Approximately 122.75,
- Bars: Medium,
- Mom: Momentum average.
WSFG Weekly
- Near-Term
- WSFG Current: 59%
- F0%/NTZ' Bias: Price Above,
- WSFG Trend: Up.
MSFG Month Nov
- Medium-Term
- MSFG Current: 19%
- F0%/NTZ' Bias: Price Above,
- MSFG Trend: Up.
YSFG Year 2026
- Far-Term
- YSFG Current: -26%
- F0%/NTZ' Bias: Price Below,
- YSFG Trend: Down.
Swing Pivots
- (Near-Term) 1. Pvt. Trend: UTrend,
- (Medium-Term) 2. HiLo Trend: DTrend,
- 3. Pvt. Evolve: Pvt high 123.53,
- 4. Pvt. Next: Pvt low 120.71,
- 5. Levels R: 169.82, 167.23, 166.79, 165.19, 161.33,
- 6. Levels S: 119.19.
Weekly Benchmarks
- (Near-Term) 5 Week: 122.25 Down Trend,
- (Near-Term) 10 Week: 121.34 Up Trend,
- (Medium-Term) 20 Week: 122.56 Down Trend,
- (Medium-Term) 55 Week: 124.28 Down Trend,
- (Far-Term) 100 Week: 126.03 Down Trend,
- (Far-Term) 200 Week: 128.47 Down Trend.
Recent Trade Signals
- 20 Nov 2026: Long FGBL 12-26 @ 122.54 Signals.USAR-MSFG
- 20 Nov 2026: Long FGBL 12-26 @ 122.22 Signals.USAR-WSFG
Overall Rating
- Near-Term: Bullish,
- Medium-Term: Bearish,
- Far-Term: Bearish.
Key Insights Summary
The swing-trading picture is a near-term recovery within a broader downtrend. The rebound from 119.19 produced an evolving pivot high at 123.53, with price now retracing part of that advance. Positive weekly and monthly grids, an upward pivot trend, and the latest long signals support the bullish near-term rating. Price is marginally above the declining 20-week benchmark, but remains below the 55-, 100-, and 200-week benchmarks. The medium-term lower-high/lower-low structure therefore remains bearish despite November's recovery. The yearly neutral zone, approximately 124.60–126.95, remains overhead, reinforcing the interpretation of a countertrend bounce rather than an established major reversal. The summary's resistance figures are distant historical levels; nearby chart-labelled resistance lies at 126.86 and 128.53. No news or seasonal catalyst can be established from this chart alone.
Chart Analysis ATS AI Generated: 2026-11-21 07:06 for Informational use only, not trading advice. Terms and Risk Disclosure Copyright © 2026. Algo Trading Systems LLC.