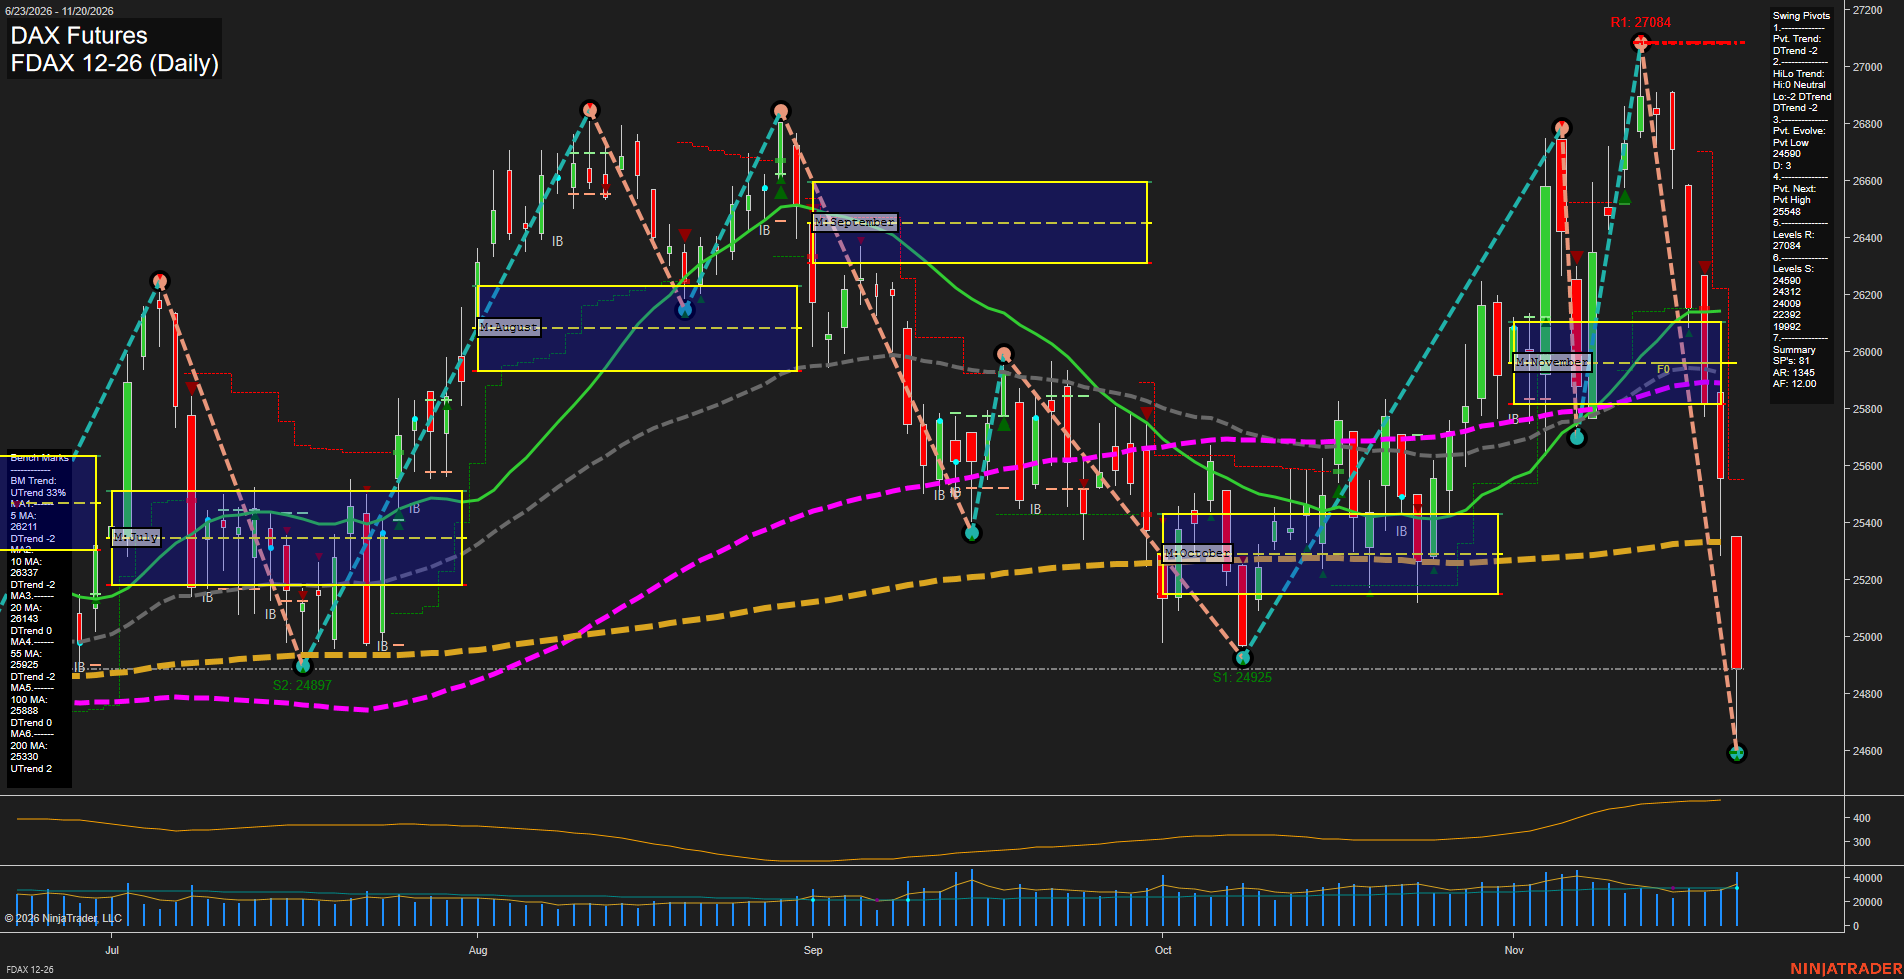
FDAX DAX Futures Daily Chart Analysis — Pre-Open: 2026-Nov-21 07:06 CT
Price Action
- Last: Approximately 24890,
- Bars: Large,
- Mom: Momentum fast.
WSFG Weekly
- Near-Term
- WSFG Current: -222%
- F0%/NTZ' Bias: Price Below,
- WSFG Trend: Down.
MSFG Month Nov
- Medium-Term
- MSFG Current: -118%
- F0%/NTZ' Bias: Price Below,
- MSFG Trend: Down.
YSFG Year 2026
- Far-Term
- YSFG Current: -13%
- F0%/NTZ' Bias: Price Below,
- YSFG Trend: Down.
Swing Pivots
- (Near-Term) 1. Pvt. Trend: DTrend,
- (Medium-Term) 2. HiLo Trend: DTrend,
- 3. Pvt. Evolve: Pvt low 24590,
- 4. Pvt. Next: Pvt high 25548,
- 5. Levels R: 27084,
- 6. Levels S: 24590, 24312, 24009, 22392, 19992.
Daily Benchmarks
- (Near-Term) 5 Day: 26211 Down Trend,
- (Near-Term) 10 Day: 26337 Down Trend,
- (Medium-Term) 20 Day: 26143 Down Trend,
- (Medium-Term) 55 Day: 25925 Down Trend,
- (Far-Term) 100 Day: 25888 Down Trend,
- (Far-Term) 200 Day: 25330 Up Trend.
Additional Metrics
Recent Trade Signals
- 19 Nov 2026: Short FDAX 12-26 @ 25795 Signals.USAR-MSFG
- 16 Nov 2026: Short FDAX 12-26 @ 26681 Signals.USAR.TR120
- 16 Nov 2026: Short FDAX 12-26 @ 26774 Signals.USAR-WSFG
Overall Rating
- Near-Term: Bearish,
- Medium-Term: Bearish,
- Far-Term: Bearish.
Key Insights Summary
From a futures swing-trading perspective, the dominant feature is a fast bearish reversal from the 27084 swing high, followed by a breakdown below November's monthly balance area and all six daily benchmarks. Large downside bars and expanding volatility characterize an impulsive selloff rather than orderly consolidation. The latest price is near the former October and July lows around 24925–24897, while the evolving pivot low extends to 24590. Weekly and monthly grid weakness, declining short- and medium-term averages, and the recent short signals reinforce bearish trend alignment. The far-term picture is also bearish overall, although the rising 200-day average remains a longer-term counterpoint; price has fallen beneath it. The 25548 next-pivot reversal threshold defines an important reference for a potential countertrend recovery, not a confirmed reversal. No news catalyst or seasonal conclusion can be established from this chart alone.
Chart Analysis ATS AI Generated: 2026-11-21 07:06 for Informational use only, not trading advice. Terms and Risk Disclosure Copyright © 2026. Algo Trading Systems LLC.