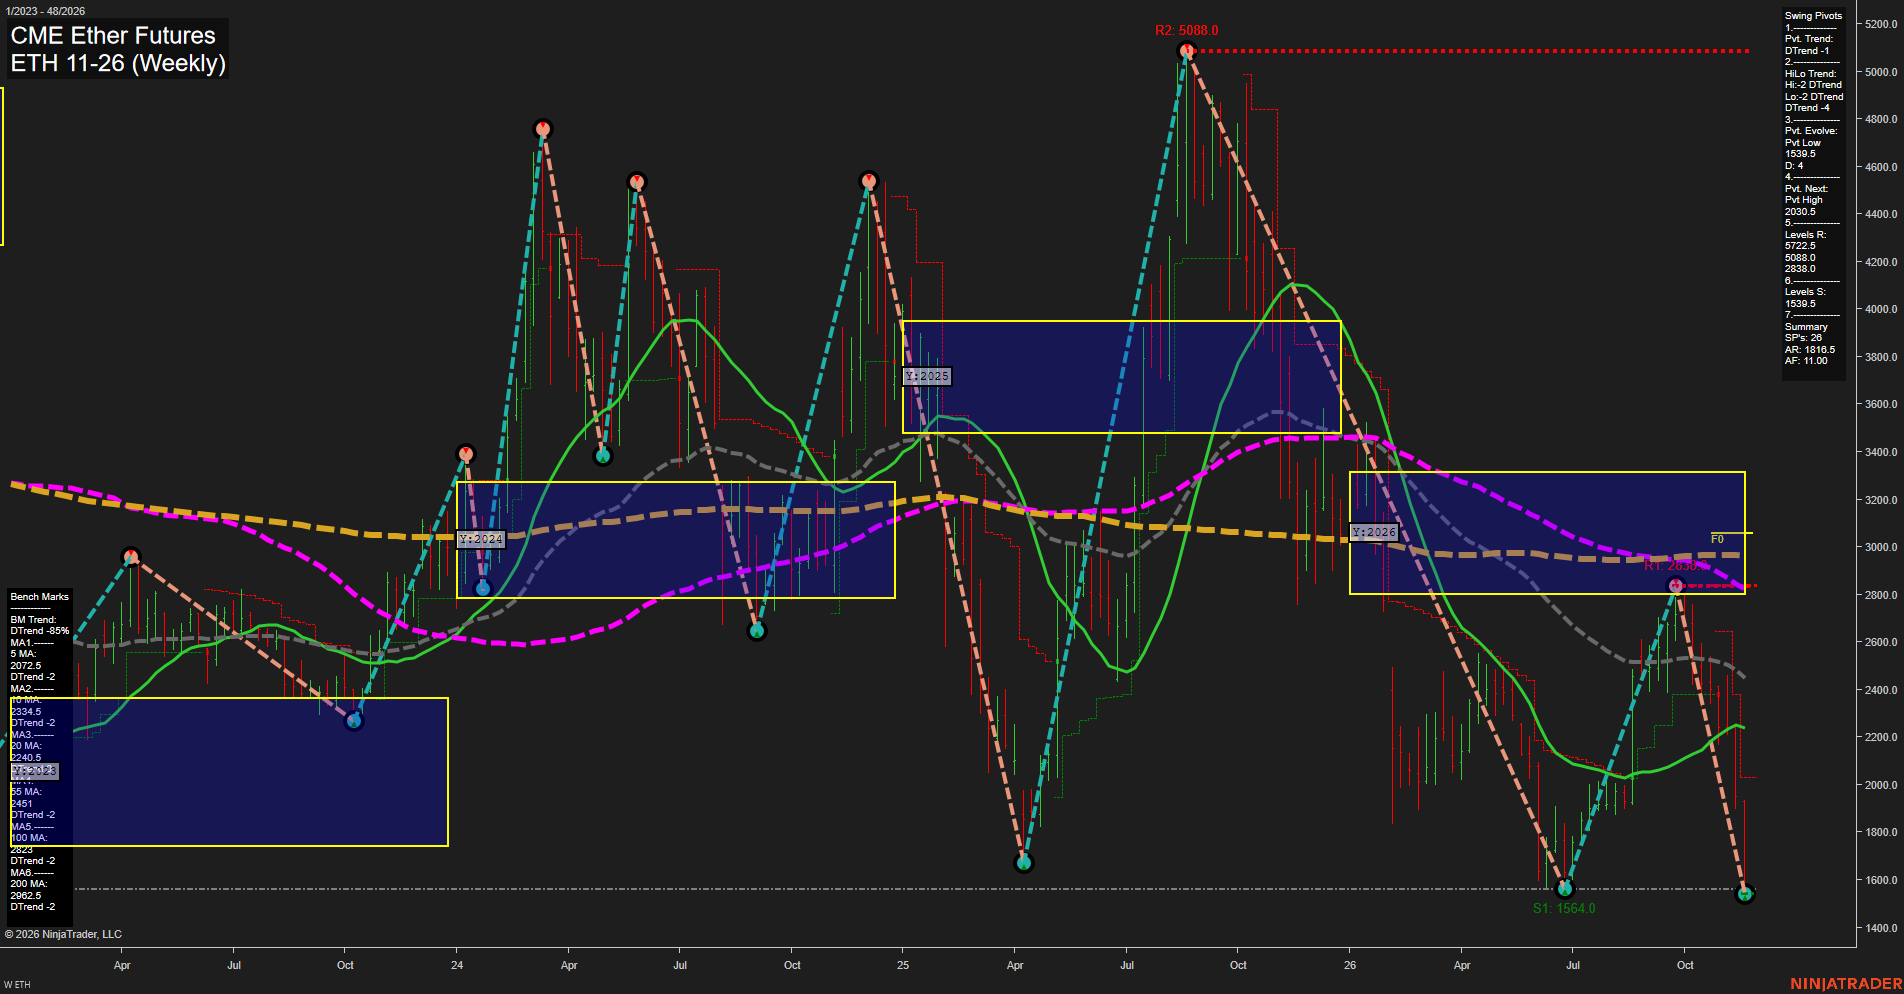
ETH CME Ether Futures Weekly Chart Analysis — Pre-Open: 2026-Nov-21 07:06 CT
Price Action
- Last: Approximately 1560,
- Bars: Large,
- Mom: Momentum fast.
WSFG Weekly
- Near-Term
- WSFG Current: -82%
- F0%/NTZ' Bias: Price Below,
- WSFG Trend: Down.
MSFG Month Nov
- Medium-Term
- MSFG Current: -113%
- F0%/NTZ' Bias: Price Below,
- MSFG Trend: Down.
YSFG Year 2026
- Far-Term
- YSFG Current: -58%
- F0%/NTZ' Bias: Price Below,
- YSFG Trend: Down.
Swing Pivots
- (Near-Term) 1. Pvt. Trend: DTrend,
- (Medium-Term) 2. HiLo Trend: DTrend,
- 3. Pvt. Evolve: Pvt low 1539.5,
- 4. Pvt. Next: Pvt high 2030.5,
- 5. Levels R: 5722.5, 5088.0, 2838.0,
- 6. Levels S: 1539.5.
Weekly Benchmarks
- (Near-Term) 5 Week: 2072.5 Down Trend,
- (Near-Term) 10 Week: 2334.5 Down Trend,
- (Medium-Term) 20 Week: 2240.5 Down Trend,
- (Medium-Term) 55 Week: 2451 Down Trend,
- (Far-Term) 100 Week: 2823 Down Trend,
- (Far-Term) 200 Week: 2962.5 Down Trend.
Recent Trade Signals
- 18 Nov 2026: Short ETH 11-26 @ 1802.5 Signals.USAR-WSFG
Overall Rating
- Near-Term: Bearish,
- Medium-Term: Bearish,
- Far-Term: Bearish.
Key Insights Summary
The weekly swing structure shows a failed recovery into 2838 followed by an accelerated selloff to an evolving low of 1539.5, undercutting the prior 1564 pivot. Large downside bars and price below all six declining benchmarks indicate trend continuation rather than a confirmed reversal. Weekly, monthly and yearly grid trends align bearishly, reinforcing the lower-high/lower-low structure across time horizons. The 2030.5 next-pivot threshold is the chart’s near-term reversal reference, while 1539.5 is the remaining listed swing support. The substantial distance below the 5-week benchmark reflects downside extension, but extension alone does not establish a durable bottom. The supplied WSFG short signal aligns with this technical picture; other signal families, news catalysts and seasonal influences are not established by the image.
Chart Analysis ATS AI Generated: 2026-11-21 07:06 for Informational use only, not trading advice. Terms and Risk Disclosure Copyright © 2026. Algo Trading Systems LLC.