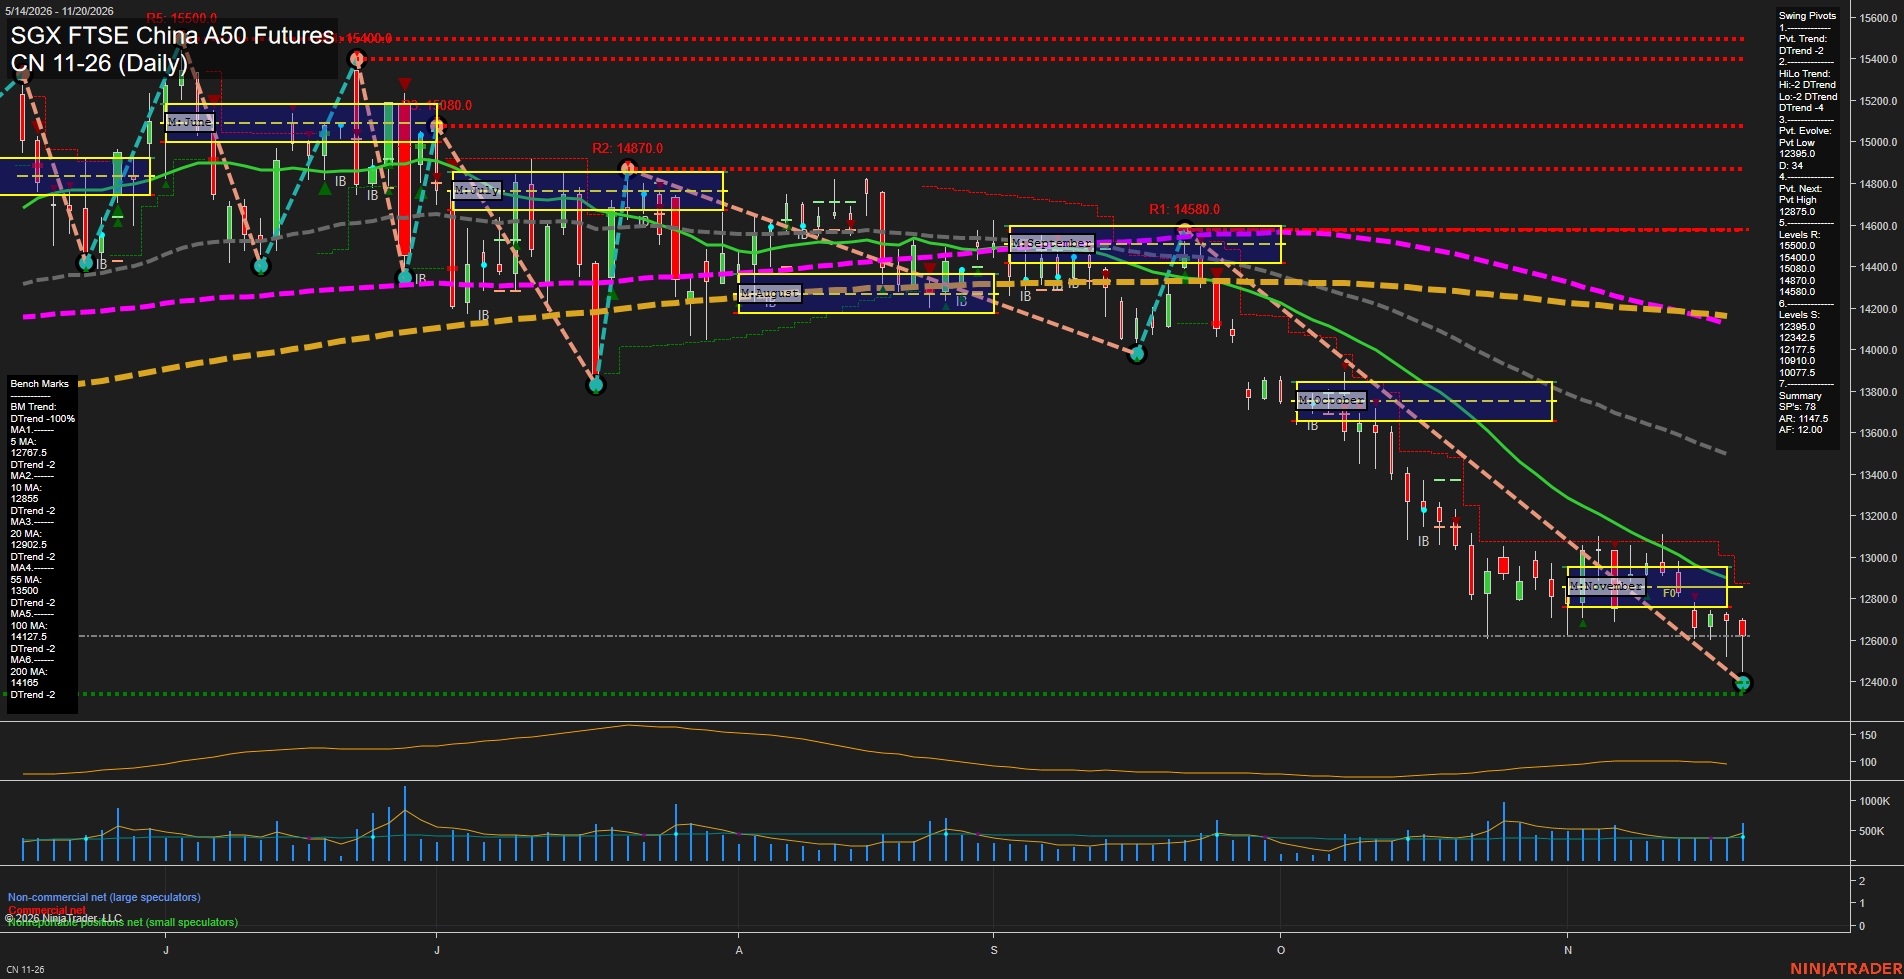
CN SGX FTSE China A50 Futures Daily Chart Analysis — Pre-Open: 2026-Nov-21 07:04 CT
Price Action
- Last: Approximately 12625,
- Bars: Medium,
- Mom: Average downside momentum.
WSFG Weekly
- Near-Term
- WSFG Current: NA%
- F0%/NTZ' Bias: Not available,
- WSFG Trend: Not available.
MSFG Month Nov
- Medium-Term
- MSFG Current: NA%
- F0%/NTZ' Bias: Price below F0% and NTZ,
- MSFG Trend: Bearish.
YSFG Year 2026
- Far-Term
- YSFG Current: NA%
- F0%/NTZ' Bias: Not available,
- YSFG Trend: Not available.
Swing Pivots
- (Near-Term) 1. Pvt. Trend: DTrend,
- (Medium-Term) 2. HiLo Trend: DTrend,
- 3. Pvt. Evolve: Pvt low 12395,
- 4. Pvt. Next: Pvt high 12875,
- 5. Levels R: 15500, 15400, 15080, 14870, 14580,
- 6. Levels S: 12395, 12342.5, 12177.5, 10910, 10077.5.
Daily Benchmarks
- (Near-Term) 5 Day: 12767.5 Down Trend,
- (Near-Term) 10 Day: 12855 Down Trend,
- (Medium-Term) 20 Day: 12902.5 Down Trend,
- (Medium-Term) 55 Day: 13500 Down Trend,
- (Far-Term) 100 Day: 14127.5 Down Trend,
- (Far-Term) 200 Day: 14165 Down Trend.
Additional Metrics
Overall Rating
- Near-Term: Bearish,
- Medium-Term: Bearish,
- Far-Term: Bearish.
Key Insights Summary
The swing-trading picture remains a persistent downtrend rather than a confirmed recovery. Lower pivot highs and lows, price beneath all six declining benchmarks, and a break below November’s monthly neutral zone align across time horizons. November’s consolidation has resolved lower, with the evolving pivot low at 12395 and nearby support at 12342.5 defining the closest downside reference area. The 12767.5–12902.5 benchmark cluster and 12875 next-pivot threshold frame overhead resistance. Recent candles show continued selling without an obvious acceleration into unusually large daily ranges; ATR is approximately 100. The chart does not provide readable weekly or yearly grids, named trade-signal summaries, or evidence supporting news-cycle or seasonal conclusions.
Chart Analysis ATS AI Generated: 2026-11-21 07:04 for Informational use only, not trading advice. Terms and Risk Disclosure Copyright © 2026. Algo Trading Systems LLC.