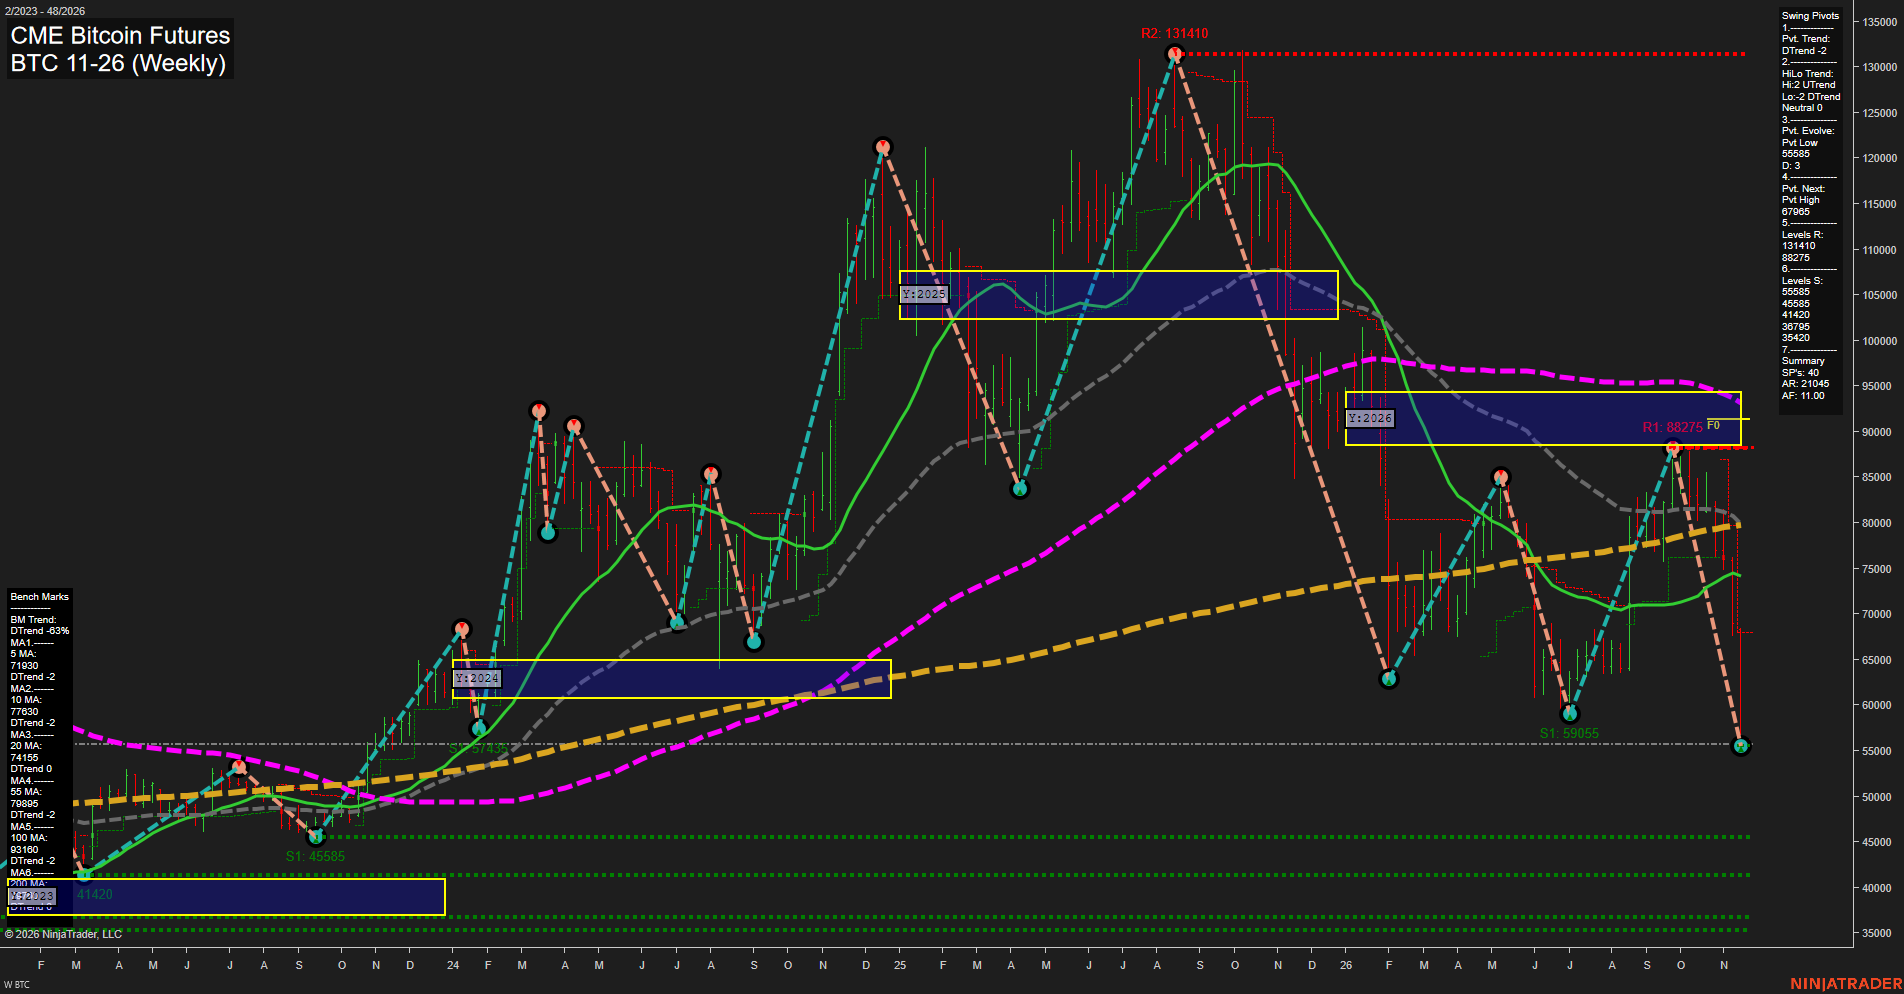
BTC CME Bitcoin Futures Weekly Chart Analysis — Pre-Open: 2026-Nov-21 07:03 CT
Price Action
- Last: Approximately 55,600,
- Bars: Large,
- Mom: Momentum fast.
WSFG Weekly
- Near-Term
- WSFG Current: -103%
- F0%/NTZ' Bias: Price Below,
- WSFG Trend: Down.
MSFG Month Nov
- Medium-Term
- MSFG Current: -146%
- F0%/NTZ' Bias: Price Below,
- MSFG Trend: Down.
YSFG Year 2026
- Far-Term
- YSFG Current: -121%
- F0%/NTZ' Bias: Price Below,
- YSFG Trend: Down.
Swing Pivots
- (Near-Term) 1. Pvt. Trend: DTrend,
- (Medium-Term) 2. HiLo Trend: Neutral,
- 3. Pvt. Evolve: Pvt low 55,585,
- 4. Pvt. Next: Pvt high 67,965,
- 5. Levels R: 131,410, 88,275,
- 6. Levels S: 55,585, 45,585, 41,420, 36,795, 35,420.
Weekly Benchmarks
- (Near-Term) 5 Week: 71,930 Down Trend,
- (Near-Term) 10 Week: 77,630 Down Trend,
- (Medium-Term) 20 Week: 74,155 Down Trend,
- (Medium-Term) 55 Week: 79,895 Down Trend,
- (Far-Term) 100 Week: 93,160 Down Trend,
- (Far-Term) 200 Week: Approximately 79,800 Up Trend.
Recent Trade Signals
- 18 Nov 2026: Short BTC 11-26 @ 64615 Signals.USAR-WSFG
Overall Rating
- Near-Term: Bearish,
- Medium-Term: Bearish,
- Far-Term: Bearish.
Key Insights Summary
The weekly structure shows a fast bearish continuation from the 88,275 swing high, breaking the prior 59,055 swing low and reaching an evolving low at 55,585. Large downside bars and price below all six benchmarks indicate broad selling pressure rather than a routine shallow retracement. The pivot summary classifies the medium-term HiLo trend as neutral, reflecting higher swing highs alongside lower swing lows, but the declining session grids and weak benchmark alignment give the overall medium-term picture a bearish bias. The 67,965 next-pivot threshold marks the chart's near-term reversal reference, not a confirmed recovery. Below 55,585, the next listed structural support is 45,585. The rising 200-week average remains a longer-cycle positive, although price substantially below it and a falling 100-week average keep the far-term assessment bearish. The supplied short signal aligns with this downside structure; the chart alone does not establish a news or seasonal catalyst.
Chart Analysis ATS AI Generated: 2026-11-21 07:04 for Informational use only, not trading advice. Terms and Risk Disclosure Copyright © 2026. Algo Trading Systems LLC.