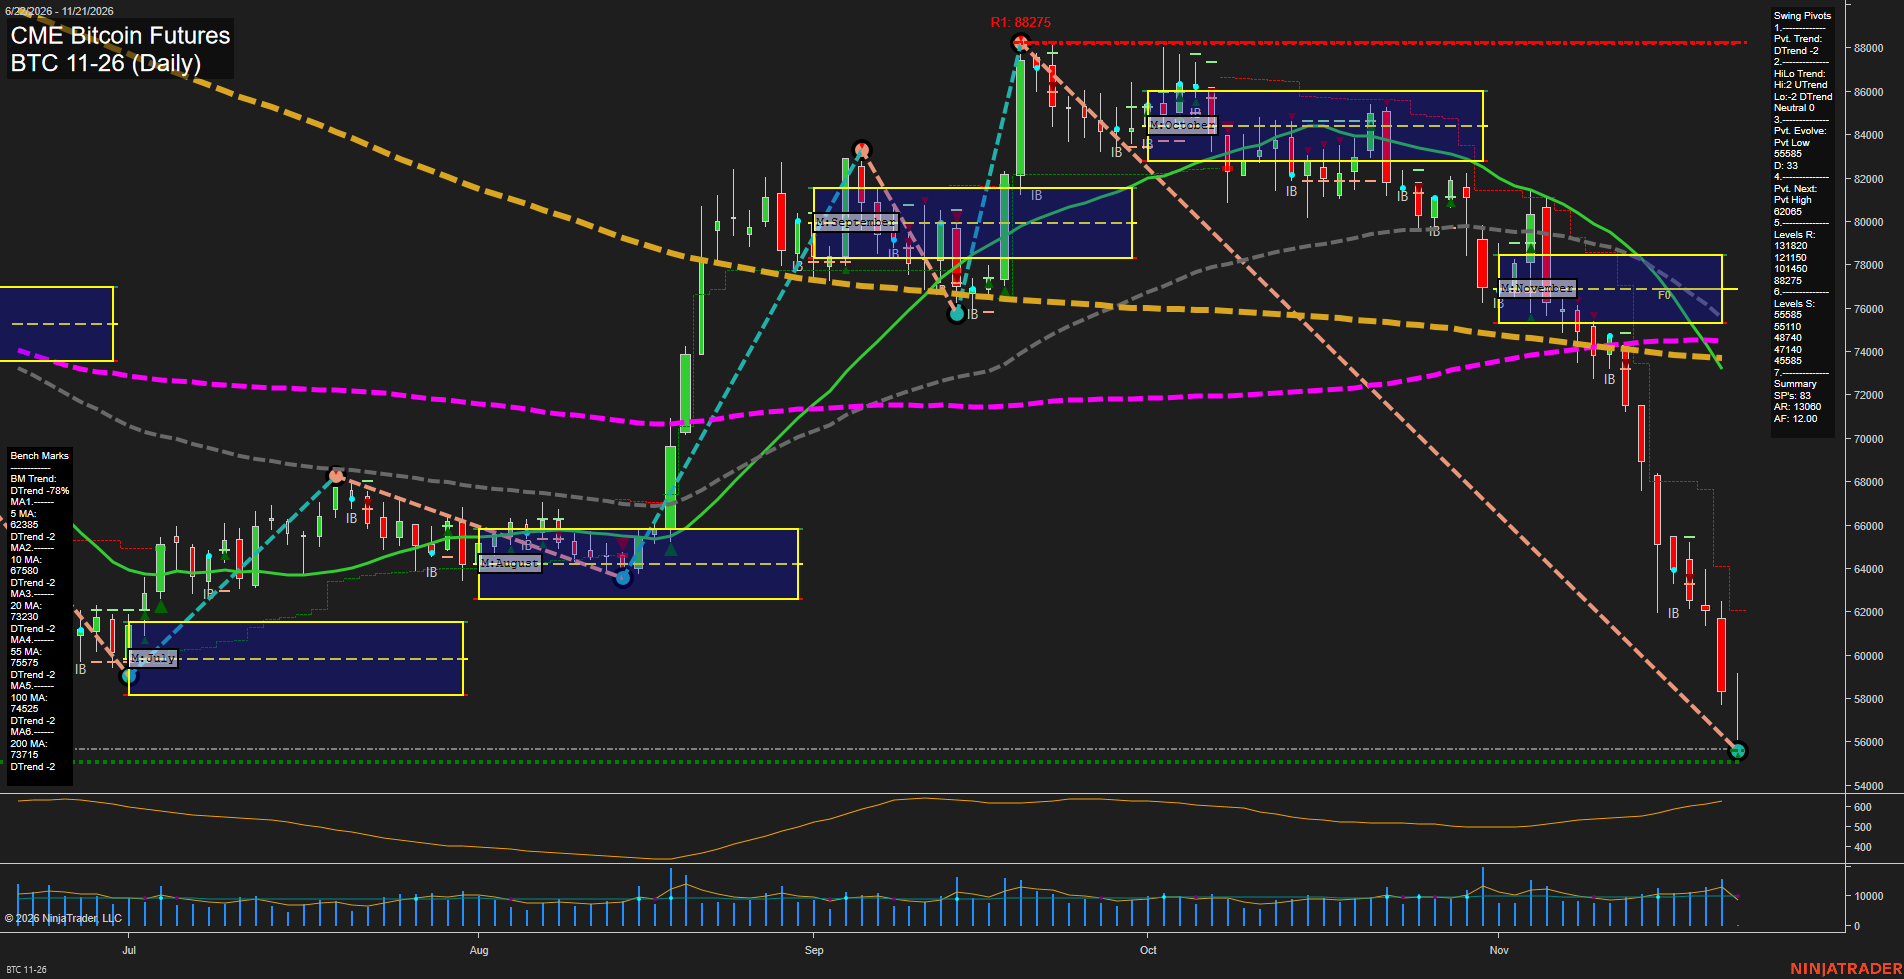
BTC CME Bitcoin Futures Daily Chart Analysis — Pre-Open: 2026-Nov-21 07:03 CT
Price Action
- Last: Approximately 55,600,
- Bars: Large,
- Mom: Momentum fast.
WSFG Weekly
- Near-Term
- WSFG Current: -103%
- F0%/NTZ' Bias: Price Below,
- WSFG Trend: Down.
MSFG Month Nov
- Medium-Term
- MSFG Current: -146%
- F0%/NTZ' Bias: Price Below,
- MSFG Trend: Down.
YSFG Year 2026
- Far-Term
- YSFG Current: -121%
- F0%/NTZ' Bias: Price Below,
- YSFG Trend: Down.
Swing Pivots
- (Near-Term) 1. Pvt. Trend: DTrend,
- (Medium-Term) 2. HiLo Trend: Neutral; high pivots UTrend, low pivots DTrend,
- 3. Pvt. Evolve: Pvt low 55,585,
- 4. Pvt. Next: Pvt high 62,065,
- 5. Levels R: 131,820, 121,150, 101,450, 88,275,
- 6. Levels S: 55,585, 55,110, 48,740, 47,140, 45,585.
Daily Benchmarks
- (Near-Term) 5 Day: 62,385 Down Trend,
- (Near-Term) 10 Day: 67,580 Down Trend,
- (Medium-Term) 20 Day: 73,230 Down Trend,
- (Medium-Term) 55 Day: 75,575 Down Trend,
- (Far-Term) 100 Day: 74,525 Down Trend,
- (Far-Term) 200 Day: 73,715 Down Trend.
Additional Metrics
Recent Trade Signals
- 18 Nov 2026: Short BTC 11-26 @ 64615 Signals.USAR-WSFG
Overall Rating
- Near-Term: Bearish,
- Medium-Term: Bearish,
- Far-Term: Bearish.
Key Insights Summary
From a futures swing-trading perspective, the chart shows an accelerating downside continuation rather than a confirmed reversal. Large bearish candles have carried price below every benchmark and all three session-grid reference zones, extending the decline approximately 37% from the 88,275 swing high. The evolving 55,585 pivot low and 55,110 support form the nearest support cluster; the next listed support is 48,740. The 62,065 next-pivot threshold marks the chart’s near-term reversal reference, while the declining 5-day and 10-day benchmarks remain overhead. Although the medium-term high/low pivot summary is neutral because its components disagree, falling medium-term averages and the monthly-grid breakdown make the broader technical balance bearish. The supplied weekly short signal aligns with that direction. No confirmed recovery pattern is evident, and the chart alone does not establish a news catalyst or seasonal explanation.
Chart Analysis ATS AI Generated: 2026-11-21 07:03 for Informational use only, not trading advice. Terms and Risk Disclosure Copyright © 2026. Algo Trading Systems LLC.