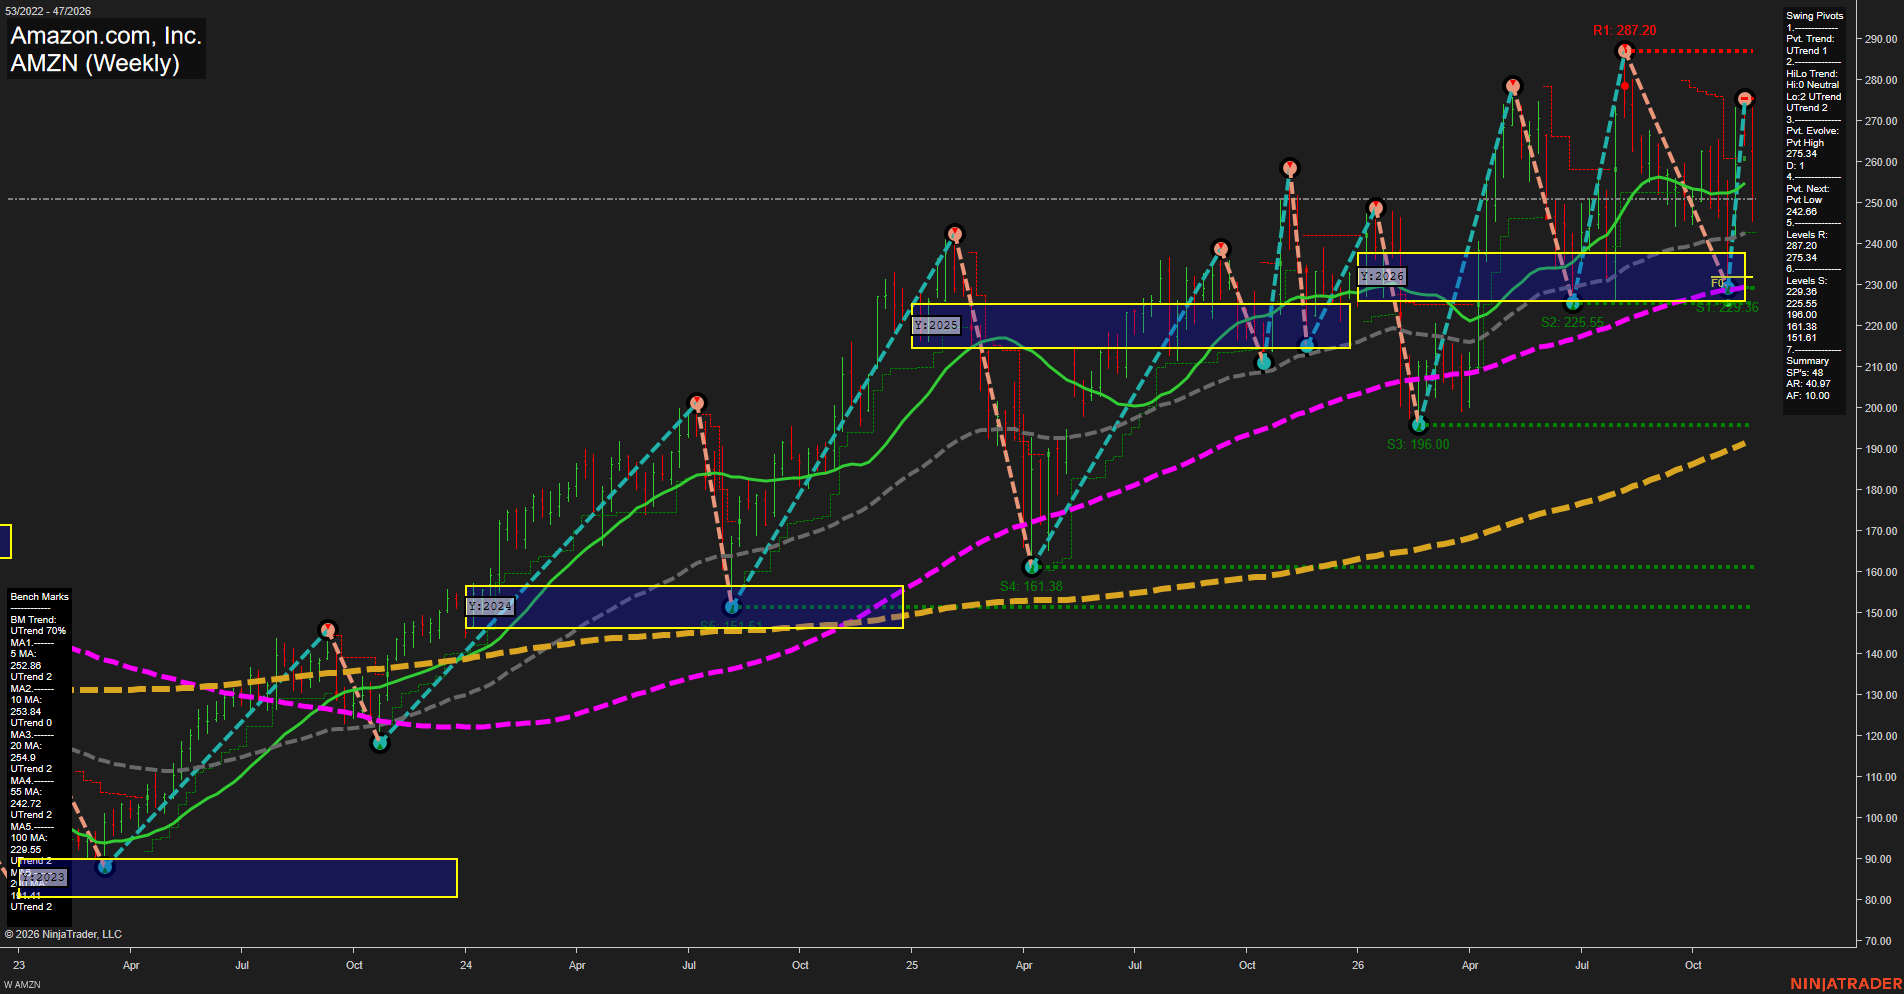
AMZN Amazon.com; Inc. Weekly Chart Analysis — Pre-Open: 2026-Nov-21 07:03 CT
Price Action
- Last: Approximately 274.00; black last-price marker not visible,
- Bars: Large,
- Mom: Momentum fast.
WSFG Weekly
- Near-Term
- WSFG Current: NA%
- F0%/NTZ' Bias: Price Neutral,
- WSFG Trend: Neutral.
MSFG Month Nov
- Medium-Term
- MSFG Current: NA%
- F0%/NTZ' Bias: Price Neutral,
- MSFG Trend: Neutral.
YSFG Year 2026
- Far-Term
- YSFG Current: NA%
- F0%/NTZ' Bias: Price above NTZ,
- YSFG Trend: Bullish.
Swing Pivots
- (Near-Term) 1. Pvt. Trend: UTrend,
- (Medium-Term) 2. HiLo Trend: UTrend; highs Neutral, lows UTrend,
- 3. Pvt. Evolve: Pvt high 275.34,
- 4. Pvt. Next: Pvt low 242.66,
- 5. Levels R: 287.20, 275.34,
- 6. Levels S: 229.36, 225.55, 196.00, 161.38, 151.61.
Weekly Benchmarks
- (Near-Term) 5 Week: 252.86 Up Trend,
- (Near-Term) 10 Week: 253.84 Up Trend,
- (Medium-Term) 20 Week: 254.90 Up Trend,
- (Medium-Term) 55 Week: 242.72 Up Trend,
- (Far-Term) 100 Week: 229.55 Up Trend,
- (Far-Term) 200 Week: Approximately 191.40 Up Trend.
Overall Rating
- Near-Term: Bullish,
- Medium-Term: Bullish,
- Far-Term: Bullish.
Key Insights Summary
From a futures swing trader’s perspective, AMZN shows an impulsive rebound from 229.36 into developing resistance at 275.34, with 287.20 remaining the major overhead pivot. This is an equity chart, not a futures contract chart; the relevant framework is weekly directional structure and range expansion. Price has recovered above all six rising benchmarks, while higher pivot lows support the medium-term advance. High pivots remain neutral, so the rebound has not yet established a fresh major high. The 252.86–254.90 benchmark cluster defines the nearest underlying trend-reference zone; the 242.66 opposite-pivot threshold closely aligns with the 55-week average at 242.72. The annual NTZ around 226–238 remains below price, reinforcing the broader bullish structure. Recent wide swings indicate elevated volatility despite the positive trend alignment. Weekly and monthly grids and the specified recent signal studies are not visible, so their neutral entries indicate unavailable confirmation rather than demonstrated sideways conditions. No news or seasonal catalyst is established by this chart.
Chart Analysis ATS AI Generated: 2026-11-21 07:03 for Informational use only, not trading advice. Terms and Risk Disclosure Copyright © 2026. Algo Trading Systems LLC.