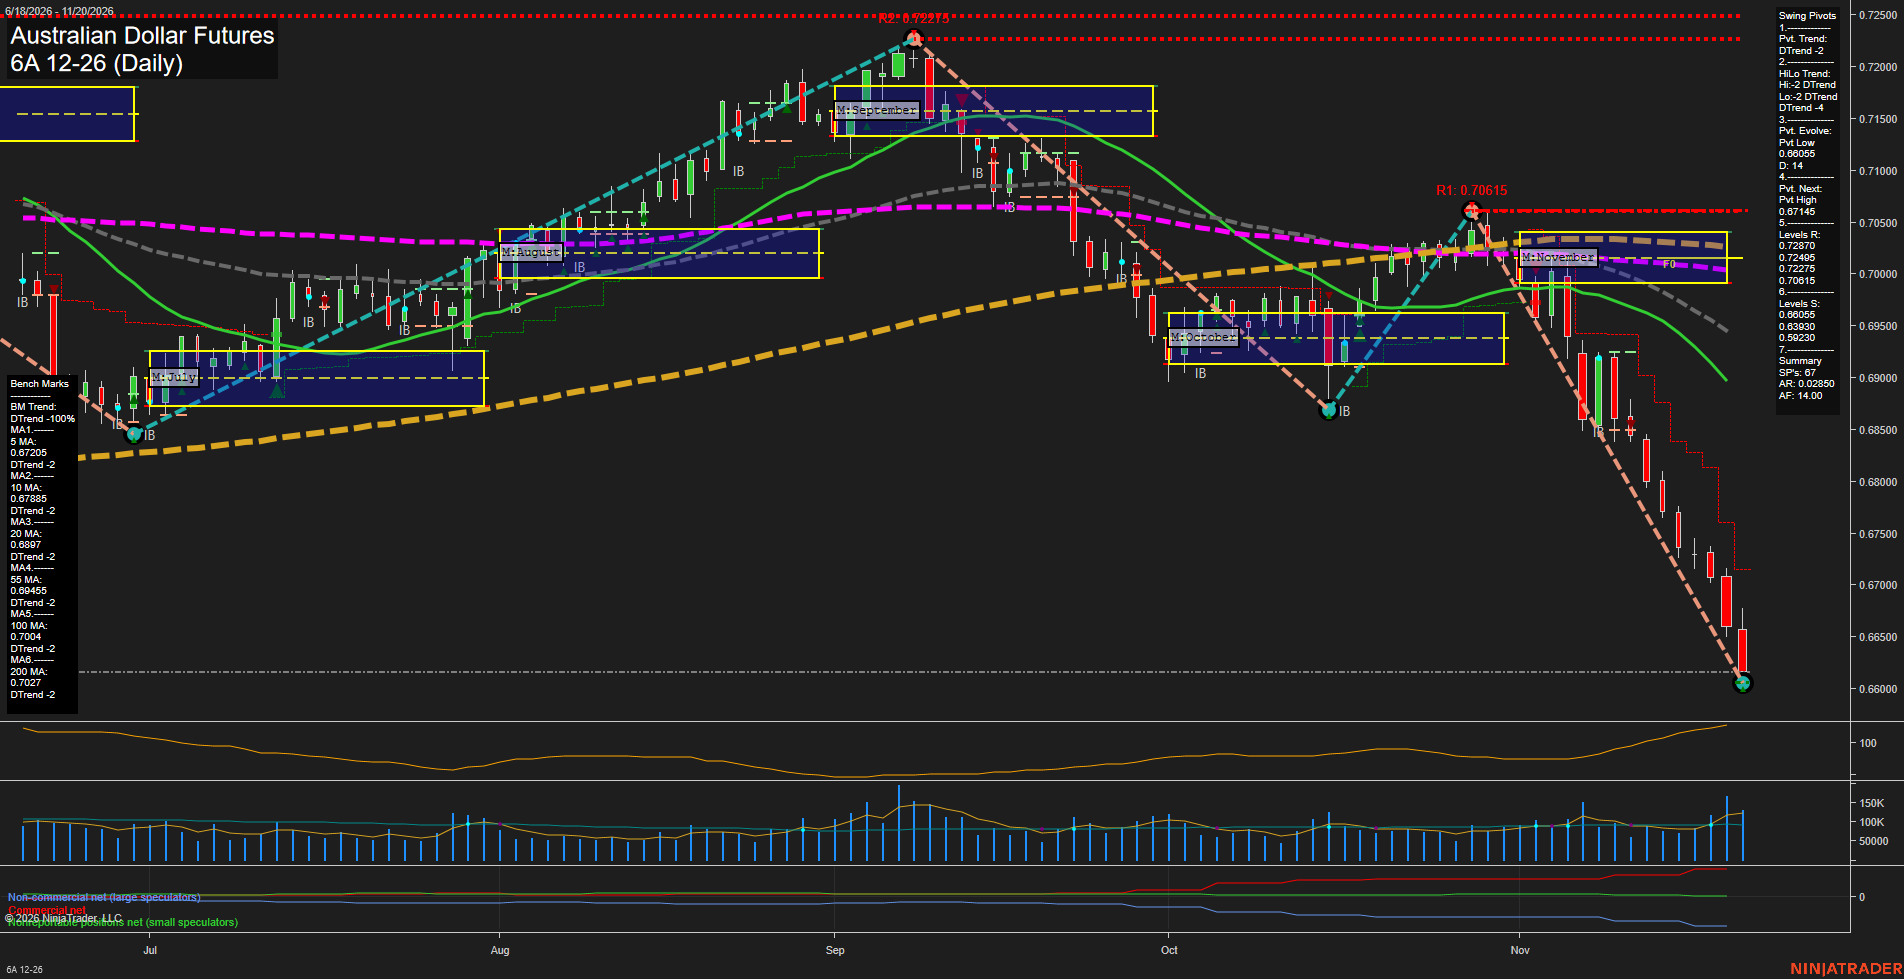
6A Australian Dollar Futures Daily Chart Analysis — Pre-Open: 2026-Nov-21 07:01 CT
Price Action
- Last: approximately 0.66160,
- Bars: Large,
- Mom: Momentum fast.
WSFG Weekly
- Near-Term
- WSFG Current: -137%
- F0%/NTZ' Bias: Price Below,
- WSFG Trend: Down.
MSFG Month Nov
- Medium-Term
- MSFG Current: -190%
- F0%/NTZ' Bias: Price Below,
- MSFG Trend: Down.
YSFG Year 2026
- Far-Term
- YSFG Current: -6%
- F0%/NTZ' Bias: Price Below,
- YSFG Trend: Down.
Swing Pivots
- (Near-Term) 1. Pvt. Trend: DTrend,
- (Medium-Term) 2. HiLo Trend: DTrend,
- 3. Pvt. Evolve: Pvt low 0.66055,
- 4. Pvt. Next: Pvt high 0.67145,
- 5. Levels R: 0.72870, 0.72495, 0.72275, 0.70615,
- 6. Levels S: 0.66055, 0.63930, 0.59230.
Daily Benchmarks
- (Near-Term) 5 Day: 0.67205 Down Trend,
- (Near-Term) 10 Day: 0.67885 Down Trend,
- (Medium-Term) 20 Day: 0.68970 Down Trend,
- (Medium-Term) 55 Day: 0.69455 Down Trend,
- (Far-Term) 100 Day: 0.70040 Down Trend,
- (Far-Term) 200 Day: 0.70270 Down Trend.
Additional Metrics
Recent Trade Signals
- 16 Nov 2026: Short 6A 12-26 @ 0.6752 Signals.USAR-WSFG
Overall Rating
- Near-Term: Bearish,
- Medium-Term: Bearish,
- Far-Term: Bearish.
Key Insights Summary
The swing-trading picture is a strong downside continuation following November’s failed recovery to 0.70615. Lower pivot highs and lows, price beneath all six falling benchmarks, and negative weekly, monthly and yearly grids establish broad bearish alignment. Large recent red candles and expanding volatility indicate accelerating selling rather than orderly consolidation, with volume strengthening into the decline. The evolving 0.66055 pivot low is the immediate support reference; 0.67145 is the displayed opposite-pivot reversal threshold, not a confirmed reversal. Price is stretched beneath its short-term averages, leaving room for a countertrend rebound without changing the broader downtrend. The recent short signal remains directionally consistent with the chart. News catalysts and seasonal effects cannot be established from this image alone.
Chart Analysis ATS AI Generated: 2026-11-21 07:01 for Informational use only, not trading advice. Terms and Risk Disclosure Copyright © 2026. Algo Trading Systems LLC.