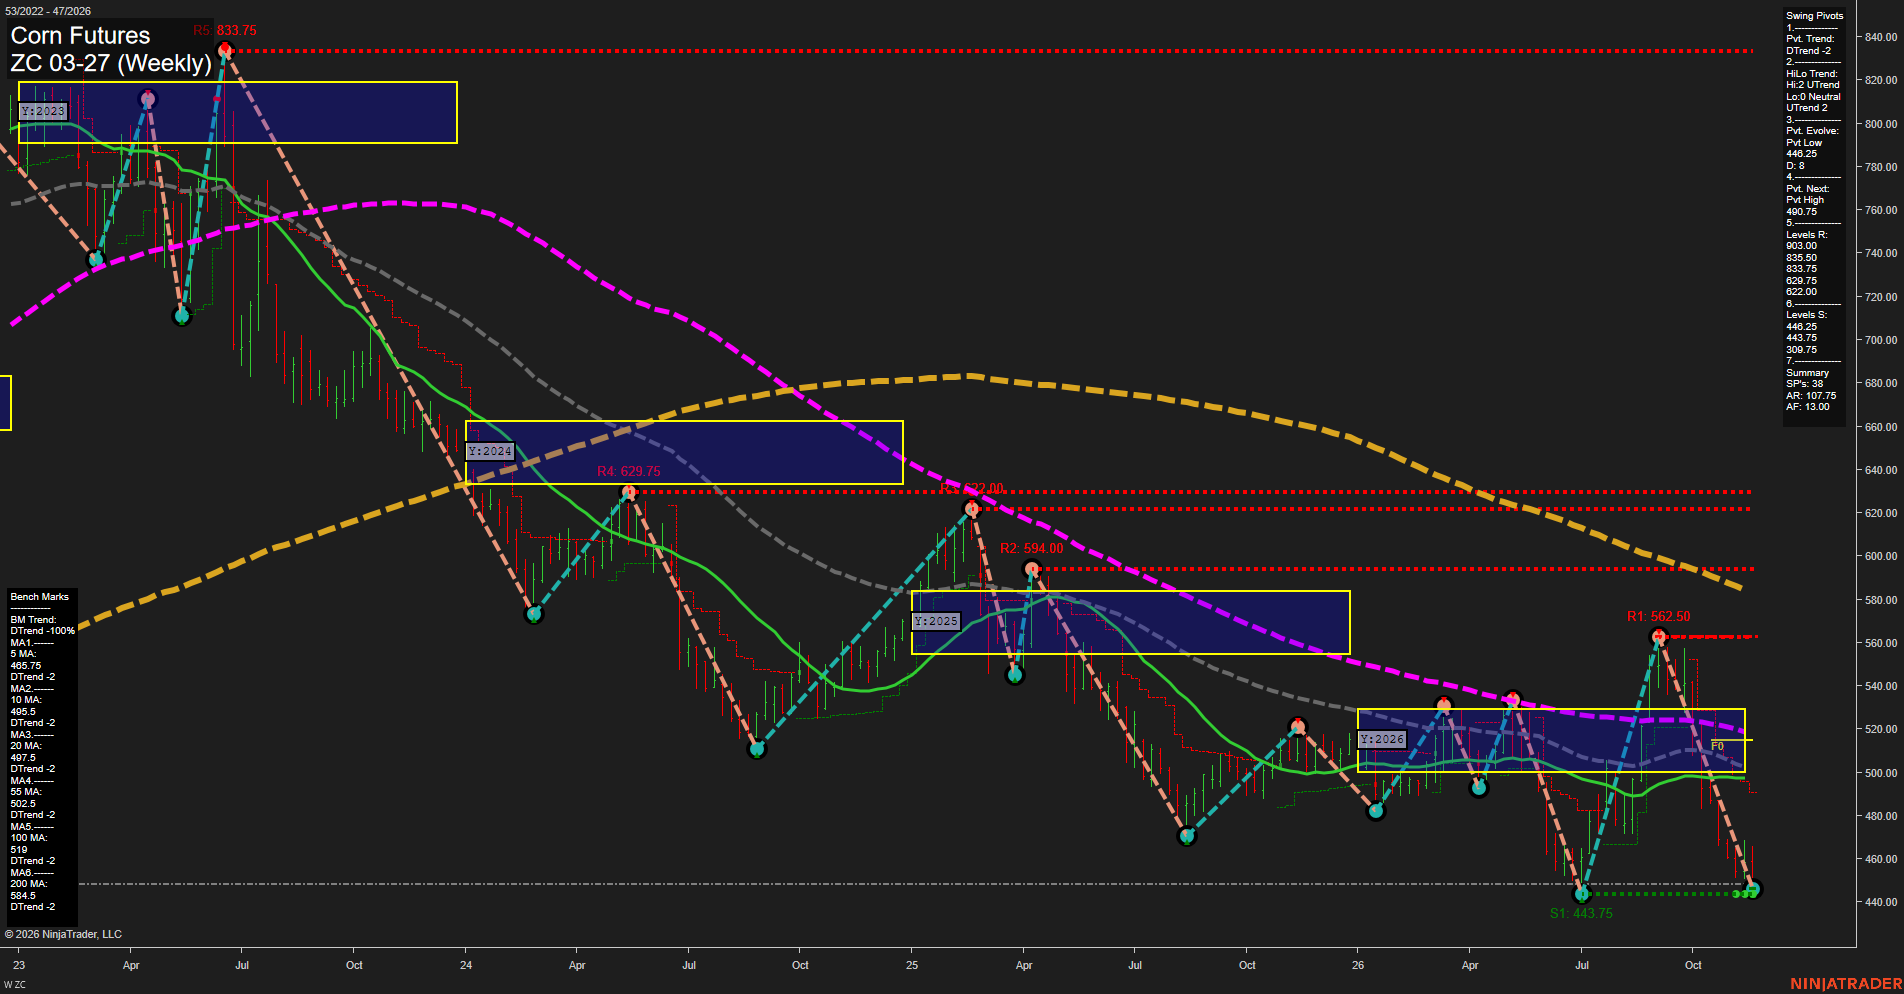
ZC Corn Futures Weekly Chart Analysis — After Market Close: 2026-Nov-20 15:17 CT
Price Action
- Last: Approximately 448.5,
- Bars: Medium,
- Mom: Momentum fast.
WSFG Weekly
- Near-Term
- WSFG Current: -76%
- F0%/NTZ' Bias: Price Below,
- WSFG Trend: Down.
MSFG Month Nov
- Medium-Term
- MSFG Current: -20%
- F0%/NTZ' Bias: Price Below,
- MSFG Trend: Down.
YSFG Year 2026
- Far-Term
- YSFG Current: -45%
- F0%/NTZ' Bias: Price Below,
- YSFG Trend: Down.
Swing Pivots
- (Near-Term) 1. Pvt. Trend: DTrend,
- (Medium-Term) 2. HiLo Trend: UTrend,
- 3. Pvt. Evolve: Pvt low 446.25,
- 4. Pvt. Next: Pvt high 490.75,
- 5. Levels R: 903.00, 835.50, 833.75, 629.75, 622.00,
- 6. Levels S: 446.25, 443.75, 309.75.
Weekly Benchmarks
- (Near-Term) 5 Week: 465.75 Down Trend,
- (Near-Term) 10 Week: 495.5 Down Trend,
- (Medium-Term) 20 Week: 497.5 Down Trend,
- (Medium-Term) 55 Week: 502.5 Down Trend,
- (Far-Term) 100 Week: 519 Down Trend,
- (Far-Term) 200 Week: 584.5 Down Trend.
Recent Trade Signals
- 20 Nov 2026: Short ZC 03-27 @ 451.5 Signals.USAR-MSFG
- 16 Nov 2026: Long ZC 12-26 @ 448.5 Signals.USAR-WSFG
Overall Rating
- Near-Term: Bearish,
- Medium-Term: Bearish,
- Far-Term: Bearish.
Key Insights Summary
The weekly swing structure shows a sharp reversal from 562.50 and a return to the summer lows, with price testing the 446.25–443.75 support cluster. Downside momentum dominates despite smaller bars near support. Price is below all six declining benchmarks and below the weekly, monthly and yearly grid reference zones, reinforcing broad bearish alignment. The medium-term HiLo UTrend is a notable counterpoint, but the current pivot downtrend and evolving 446.25 low show renewed pressure on that structure. The 490.75 opposite-pivot threshold and the 495.5–502.5 benchmark cluster mark substantial overhead technical reference points. Recent signals are mixed across different delivery contracts, with the newer monthly short contrasting with the earlier weekly long. The chart establishes a support retest, not a confirmed double bottom or bullish reversal; no accompanying news or fundamental data establishes a seasonal catalyst.
Chart Analysis ATS AI Generated: 2026-11-20 15:17 for Informational use only, not trading advice. Terms and Risk Disclosure Copyright © 2026. Algo Trading Systems LLC.