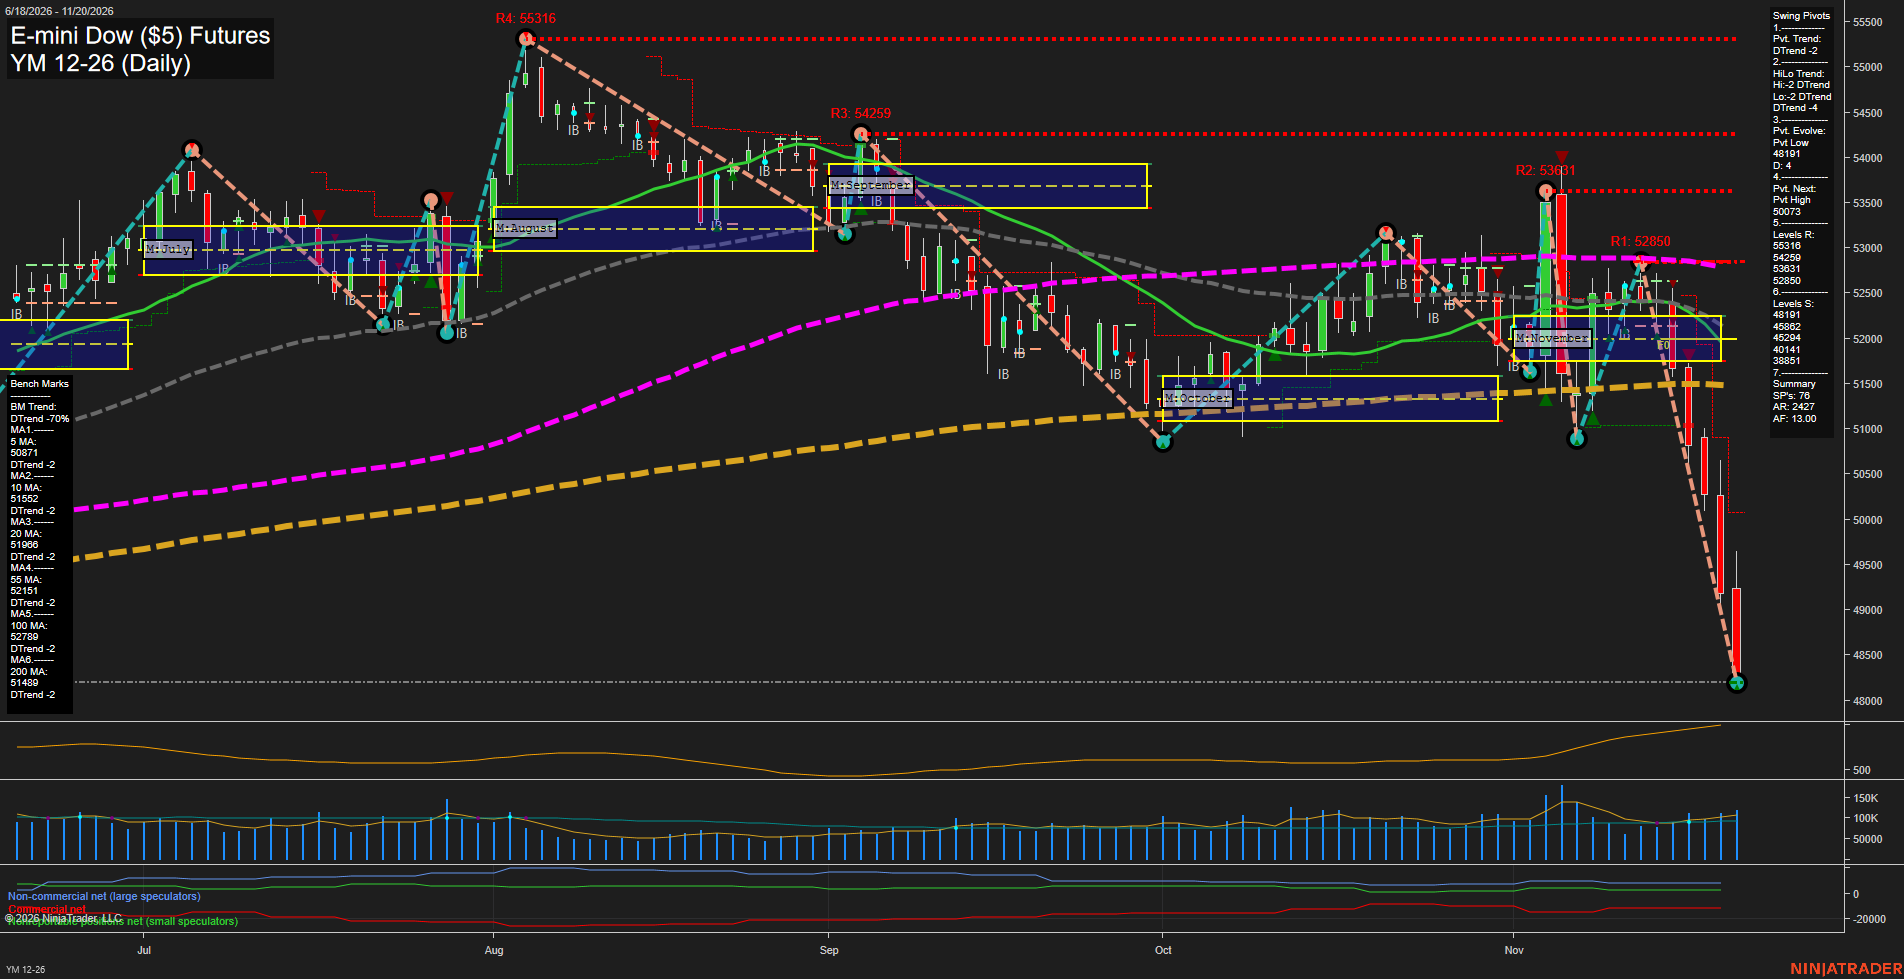
YM E-mini Dow ($5) Futures Daily Chart Analysis — After Market Close: 2026-Nov-20 15:15 CT
Price Action
- Last: approximately 48200,
- Bars: Large,
- Mom: Momentum fast.
WSFG Weekly
- Near-Term
- WSFG Current: -240%
- F0%/NTZ' Bias: Price Below,
- WSFG Trend: Down.
MSFG Month Nov
- Medium-Term
- MSFG Current: -172%
- F0%/NTZ' Bias: Price Below,
- MSFG Trend: Down.
YSFG Year 2026
- Far-Term
- YSFG Current: -28%
- F0%/NTZ' Bias: Price Below,
- YSFG Trend: Down.
Swing Pivots
- (Near-Term) 1. Pvt. Trend: DTrend,
- (Medium-Term) 2. HiLo Trend: DTrend,
- 3. Pvt. Evolve: Pvt low 48191,
- 4. Pvt. Next: Pvt high 50073,
- 5. Levels R: 55316, 54259, 53631, 52850,
- 6. Levels S: 48191, 45862, 45294, 40141, 38851.
Daily Benchmarks
- (Near-Term) 5 Day: 50871 Down Trend,
- (Near-Term) 10 Day: 51552 Down Trend,
- (Medium-Term) 20 Day: 51986 Down Trend,
- (Medium-Term) 55 Day: 52151 Down Trend,
- (Far-Term) 100 Day: 52789 Down Trend,
- (Far-Term) 200 Day: 51489 Down Trend.
Additional Metrics
Recent Trade Signals
- 16 Nov 2026: Short YM 12-26 @ 51715 Signals.USAR-MSFG
- 16 Nov 2026: Short YM 12-26 @ 52148 Signals.USAR.TR120
- 16 Nov 2026: Short YM 12-26 @ 52178 Signals.USAR-WSFG
Overall Rating
- Near-Term: Bearish,
- Medium-Term: Bearish,
- Far-Term: Bearish.
Key Insights Summary
From a futures swing-trading perspective, the chart shows an accelerating bearish continuation following rejection at 52850. Large consecutive down bars have broken the October and early-November lows, with price finishing near the evolving 48191 pivot low. Weekly, monthly and yearly grid readings align bearishly, while price sits below all six declining benchmarks. Rising ATR indicates expanding daily volatility; price is approximately 2671 points below its five-day benchmark, highlighting substantial short-term downside extension rather than evidence of a confirmed reversal. The next-pivot reversal reference is 50073, and the nearest listed support below 48191 is 45862. The supplied near- and medium-term short signals agree with the breakdown; no TR720 signal is supplied. Overall, trend deterioration spans all three horizons, with no confirmed basing structure visible. News catalysts and seasonal effects cannot be established from this chart alone.
Chart Analysis ATS AI Generated: 2026-11-20 15:16 for Informational use only, not trading advice. Terms and Risk Disclosure Copyright © 2026. Algo Trading Systems LLC.