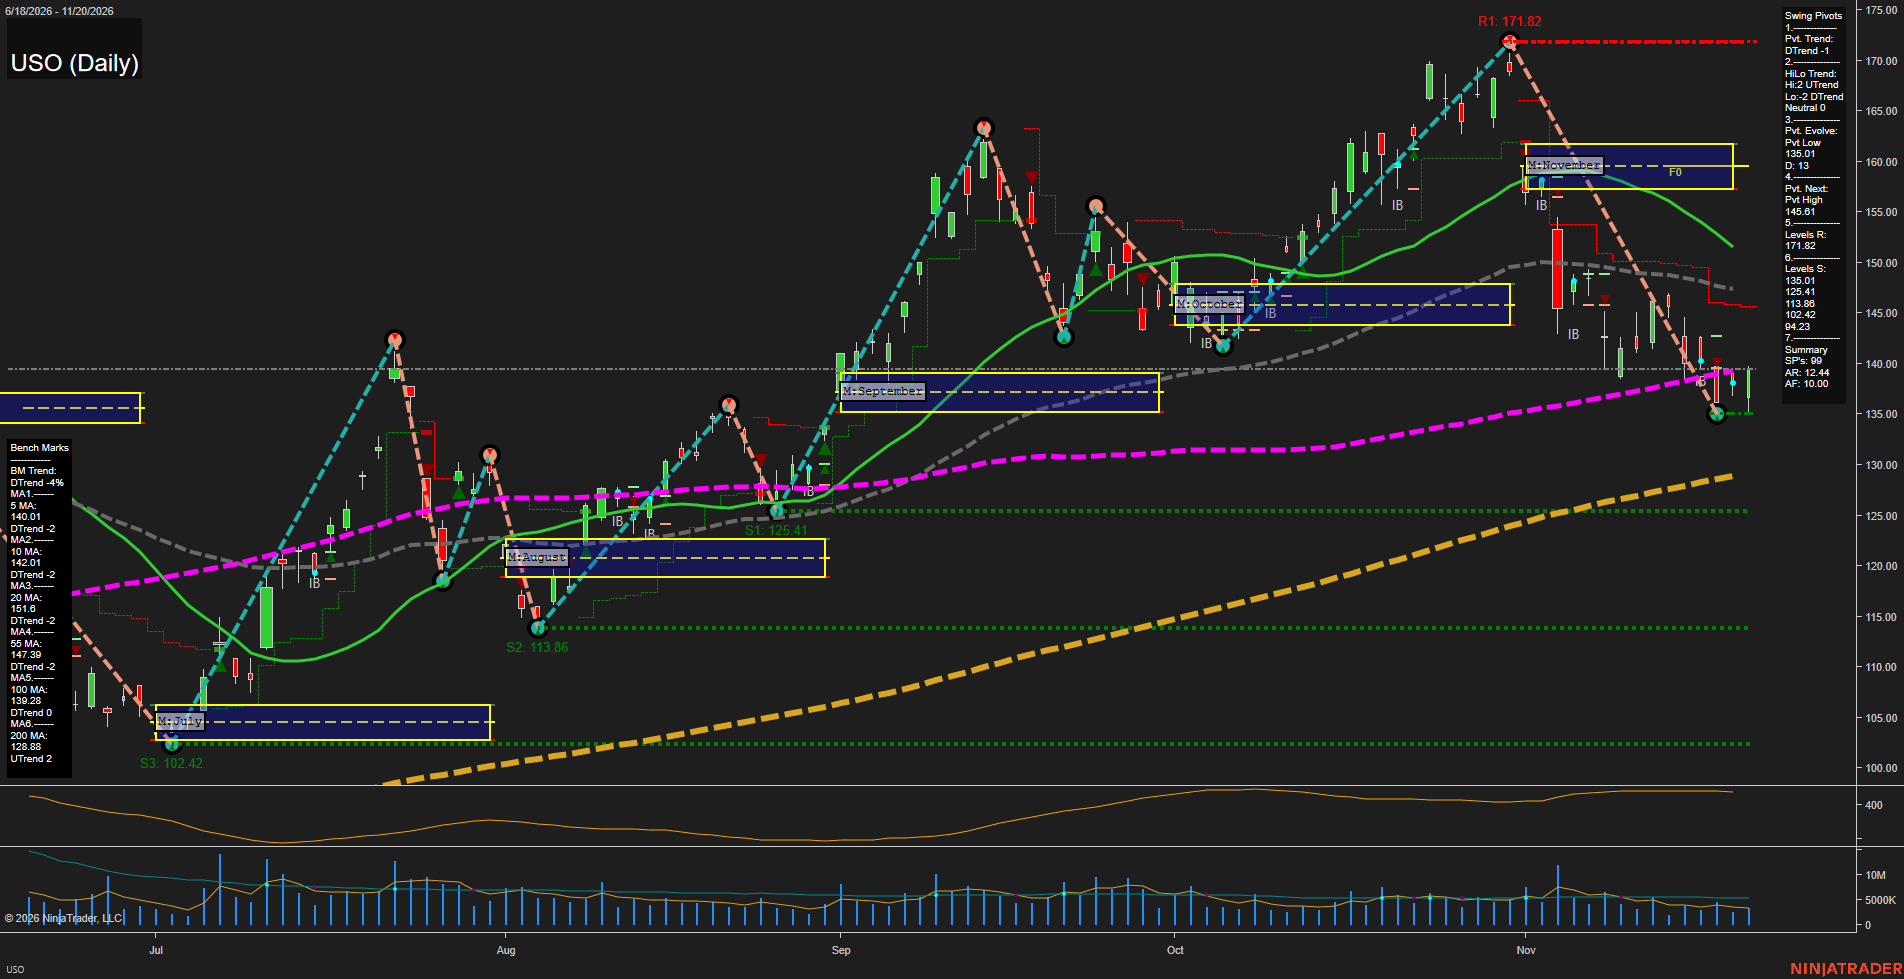
USO United States Oil Fund LP Daily Chart Analysis — After Market Close: 2026-Nov-20 15:15 CT
Price Action
- Last: approximately 139.50,
- Bars: Small,
- Mom: Momentum slow.
WSFG Weekly
- Near-Term
- WSFG Current: NA%
- F0%/NTZ' Bias: Price Neutral,
- WSFG Trend: Neutral.
MSFG Month Nov
- Medium-Term
- MSFG Current: NA%
- F0%/NTZ' Bias: Price below F0% and NTZ,
- MSFG Trend: Bearish.
YSFG Year 2026
- Far-Term
- YSFG Current: NA%
- F0%/NTZ' Bias: Price Neutral,
- YSFG Trend: Neutral.
Swing Pivots
- (Near-Term) 1. Pvt. Trend: DTrend,
- (Medium-Term) 2. HiLo Trend: Neutral,
- 3. Pvt. Evolve: Pvt low 135.01,
- 4. Pvt. Next: Pvt high 145.61,
- 5. Levels R: 171.82,
- 6. Levels S: 135.01, 125.41, 113.86, 102.42, 94.23.
Daily Benchmarks
- (Near-Term) 5 Day: 140.01 Down Trend,
- (Near-Term) 10 Day: 142.01 Down Trend,
- (Medium-Term) 20 Day: 151.60 Down Trend,
- (Medium-Term) 55 Day: 147.39 Down Trend,
- (Far-Term) 100 Day: 139.28 Down Trend,
- (Far-Term) 200 Day: 128.88 Up Trend.
Additional Metrics
- ATR: 138,
- VOLMA: 2577640.
Overall Rating
- Near-Term: Bearish,
- Medium-Term: Bearish,
- Far-Term: Neutral.
Key Insights Summary
From a futures swing trader’s perspective, USO shows a sharp corrective downswing from 171.82 to 135.01, followed by a small-bar stabilization near the 100-day benchmark. Price remains below declining 5-, 10-, 20- and 55-day averages and well beneath November’s monthly neutral zone around 157–162, leaving the rebound countertrend rather than a confirmed reversal. The pivot summary remains in a near-term downtrend, with 145.61 identified as the next opposite-pivot reversal threshold. Medium-term pivot structure is mixed, combining higher highs with lower lows. Support is concentrated at 135.01, followed by 125.41; the rising 200-day average at 128.88 preserves a contrasting longer-term bullish element. Recent volume is subdued relative to earlier selloff activity, suggesting limited participation in stabilization. Weekly and yearly grids and named strategy signals are not visible, so their direction cannot be independently verified. USO is an oil-futures-linked fund rather than a futures contract; contract-specific roll effects and spreads are not shown, and the chart alone does not establish news or seasonal drivers.
Chart Analysis ATS AI Generated: 2026-11-20 15:15 for Informational use only, not trading advice. Terms and Risk Disclosure Copyright © 2026. Algo Trading Systems LLC.