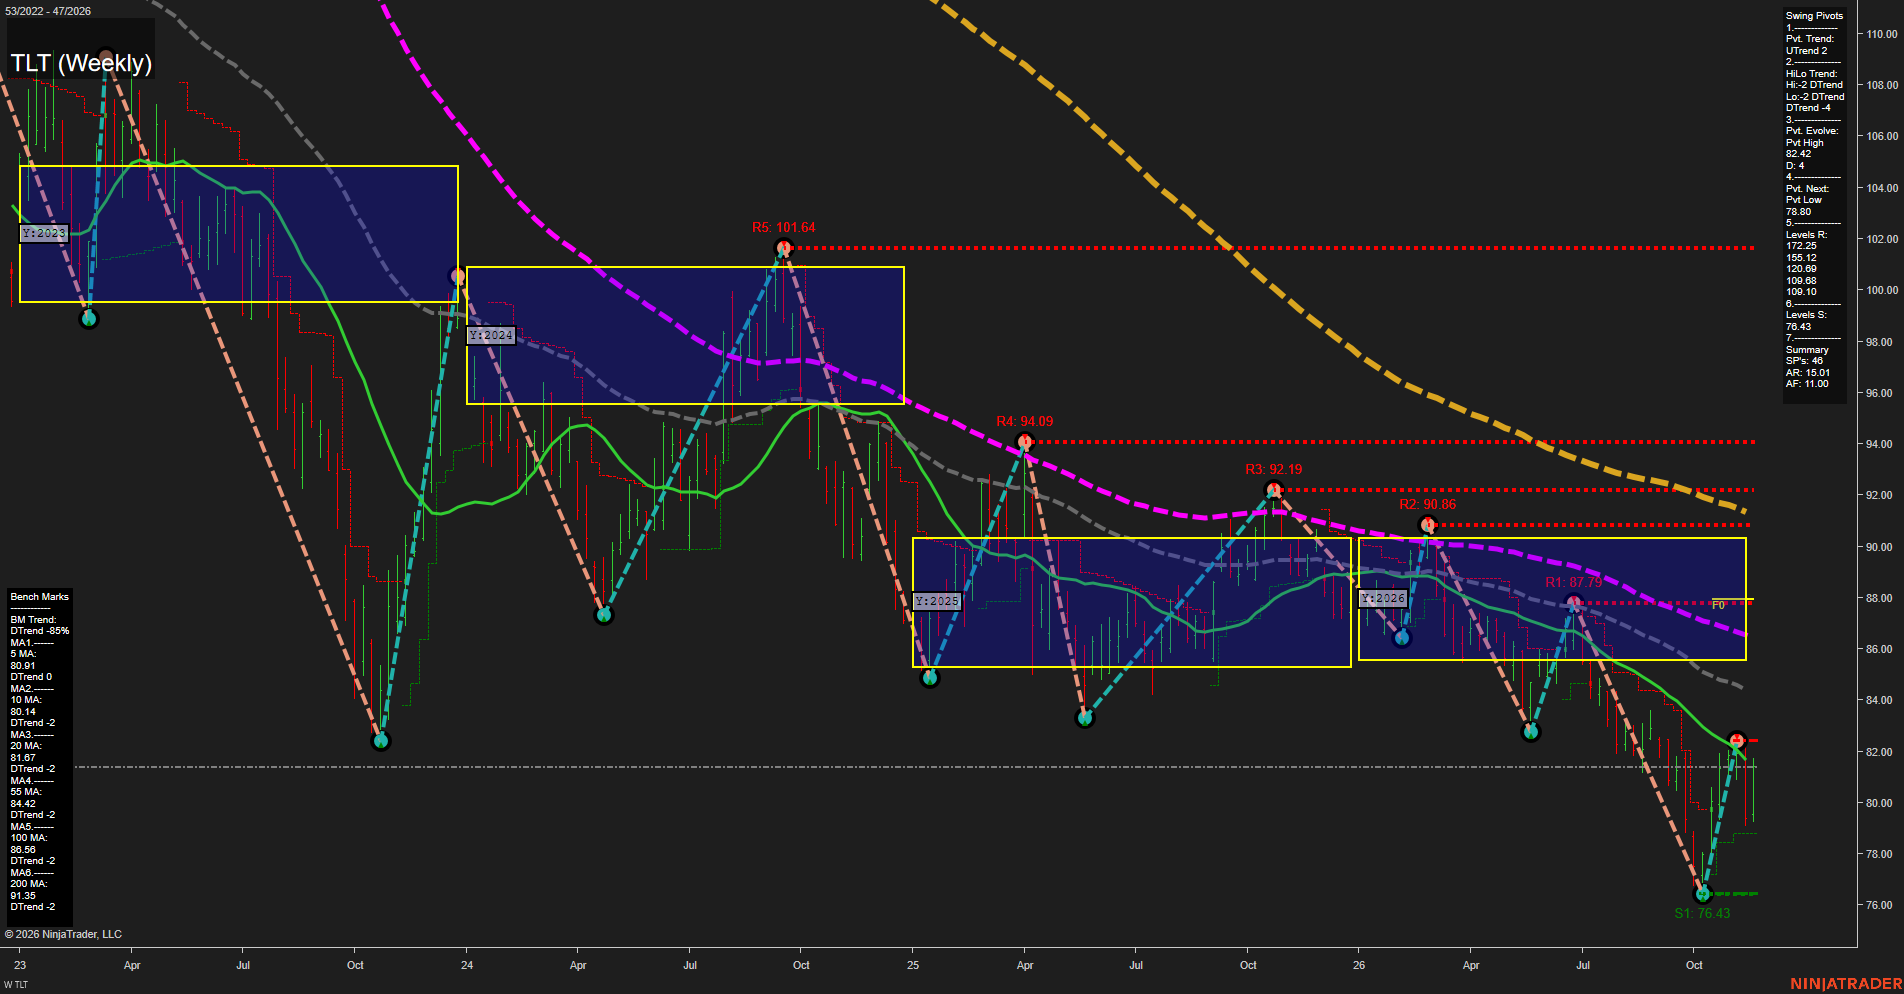
From a futures swing trader’s perspective, TLT shows a countertrend Treasury-duration rebound within a broader downtrend, rather than a confirmed trend reversal. Price has recovered from 76.43 and stands above the 5- and 10-week benchmarks, but remains below the declining 20-week benchmark at 81.67. The evolving 82.42 pivot high defines the immediate rebound extreme; 78.80 is the summary’s next downside pivot-reversal threshold. The medium-term lower-high/lower-low structure remains bearish, reinforced by price trading below the 55-, 100-, and 200-week benchmarks. The 5-week benchmark’s displayed trend score is zero, indicating flattening despite its DTrend label. Resistance values listed above reproduce the summary, although they differ from the visible chart annotations at 101.64, 94.09, 92.19, 90.86, and 87.79. Weekly and monthly grids and the requested recent signal studies are not visible, so their direction cannot be independently confirmed; the neutral grid entries are placeholders. The visible yearly grid places price below its approximately 85.6–90.3 neutral zone and its approximately 87.8 centerline, supporting a bearish far-term interpretation. TLT provides a duration-market proxy, not a Treasury futures price chart; no news or seasonal catalyst is established by this image.