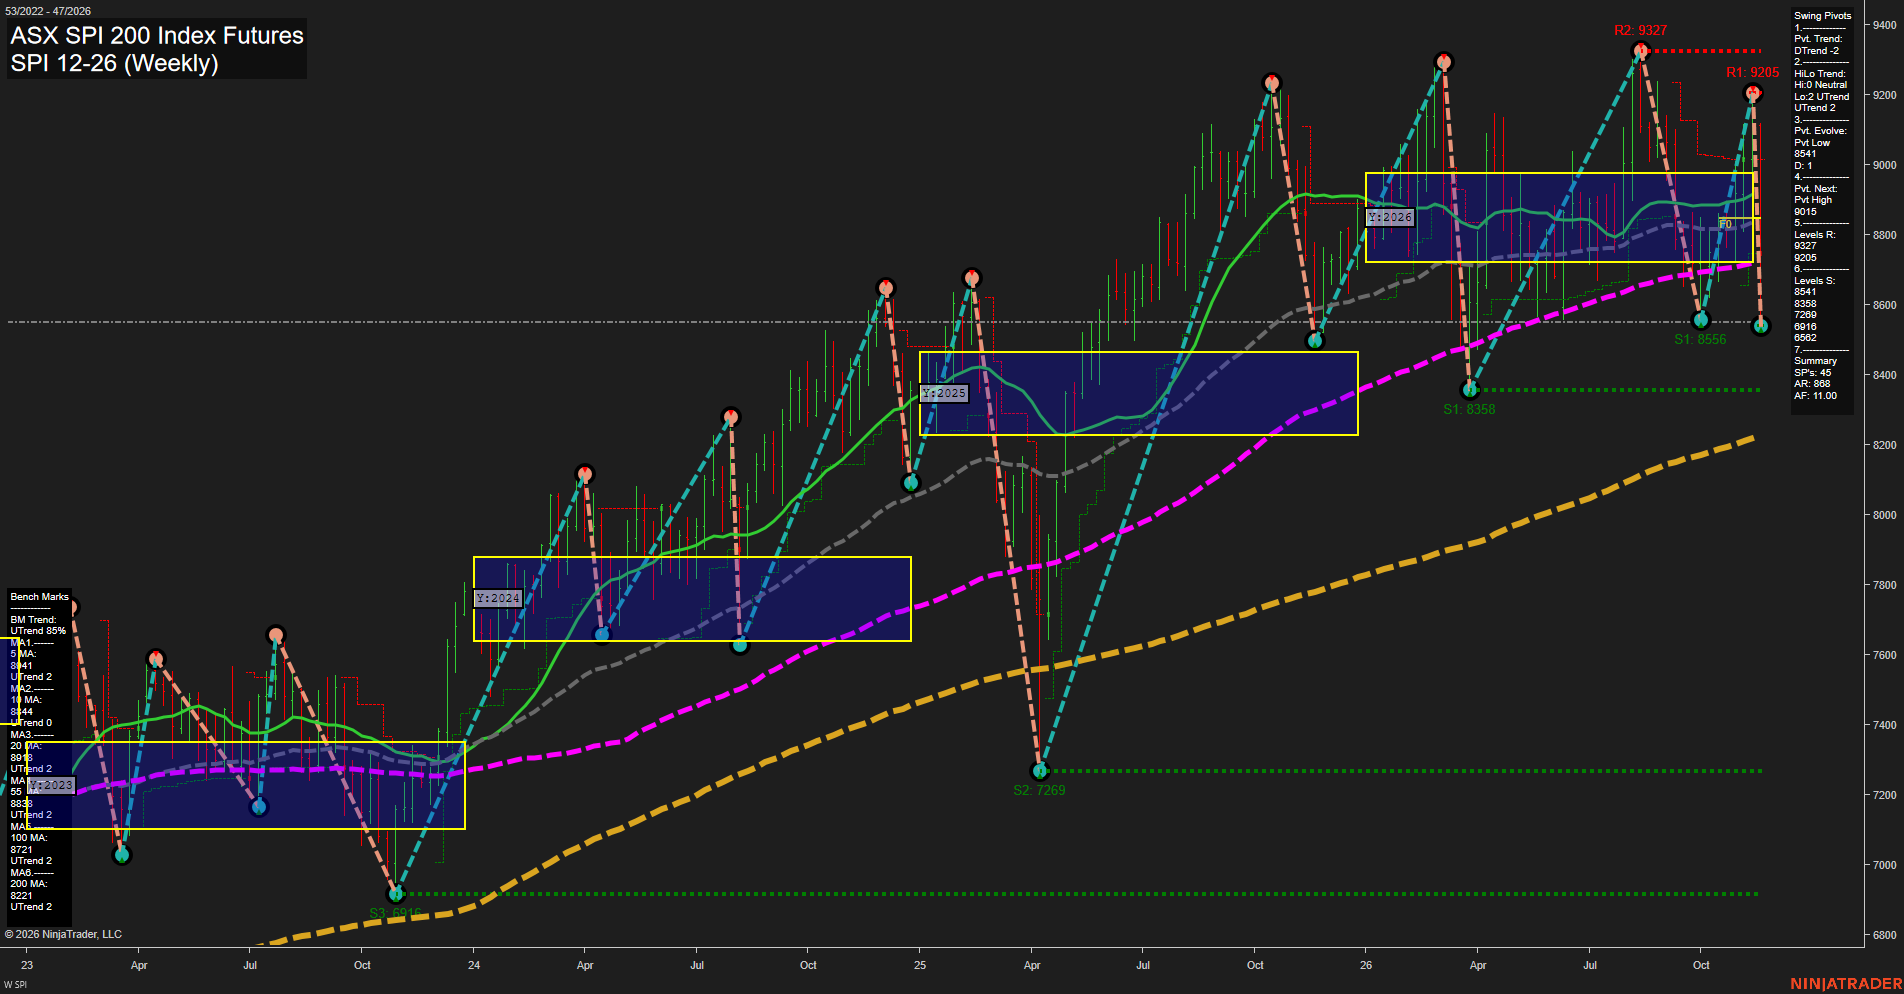
SPI ASX SPI 200 Index Futures Weekly Chart Analysis — After Market Close: 2026-Nov-20 15:13 CT
Price Action
- Last: Approximately 8550,
- Bars: Large,
- Mom: Momentum fast.
WSFG Weekly
- Near-Term
- WSFG Current: NA%
- F0%/NTZ' Bias: Price Neutral, unconfirmed,
- WSFG Trend: Neutral, not displayed.
MSFG Month Nov
- Medium-Term
- MSFG Current: NA%
- F0%/NTZ' Bias: Price Neutral, unconfirmed,
- MSFG Trend: Neutral, not displayed.
YSFG Year 2026
- Far-Term
- YSFG Current: NA%
- F0%/NTZ' Bias: Price below F0% and NTZ,
- YSFG Trend: Bearish.
Swing Pivots
- (Near-Term) 1. Pvt. Trend: DTrend,
- (Medium-Term) 2. HiLo Trend: UTrend,
- 3. Pvt. Evolve: Pvt low 8541,
- 4. Pvt. Next: Pvt high 9015,
- 5. Levels R: 9327, 9205,
- 6. Levels S: 8541, 8358, 7269, 6916, 6562.
Weekly Benchmarks
- (Near-Term) 5 Week: Approximately 8841 Up Trend,
- (Near-Term) 10 Week: Approximately 8844 Up Trend,
- (Medium-Term) 20 Week: 8918 Up Trend,
- (Medium-Term) 55 Week: Approximately 8833 Up Trend,
- (Far-Term) 100 Week: 8721 Up Trend,
- (Far-Term) 200 Week: 8221 Up Trend.
Overall Rating
- Near-Term: Bearish,
- Medium-Term: Neutral,
- Far-Term: Bullish.
Key Insights Summary
The latest large weekly decline has reversed the rebound from 8556 to 9205, leaving price near the evolving 8541 pivot low. This lower high and marginal undercut of the previous low indicate renewed near-term selling pressure. Price is below the 2026 yearly neutral zone, approximately 8720–8980, and below the 5-, 10-, 20-, 55- and 100-week benchmarks. The medium-term picture is mixed because the HiLo pivot summary remains in an uptrend while price has weakened beneath rising averages. The broader trend retains bullish structural characteristics through rising 100- and 200-week benchmarks and price above the 200-week average, although yearly-grid positioning is bearish. Resistance remains at 9205 and 9327; below 8541, the next listed support is 8358. Weekly and monthly grids and the specified recent-signal indicators are not displayed, so their direction cannot be confirmed. The chart depicts a sharp countertrend downswing within a broader rising structure; news and seasonal explanations are not established by the image.
Chart Analysis ATS AI Generated: 2026-11-20 15:13 for Informational use only, not trading advice. Terms and Risk Disclosure Copyright © 2026. Algo Trading Systems LLC.