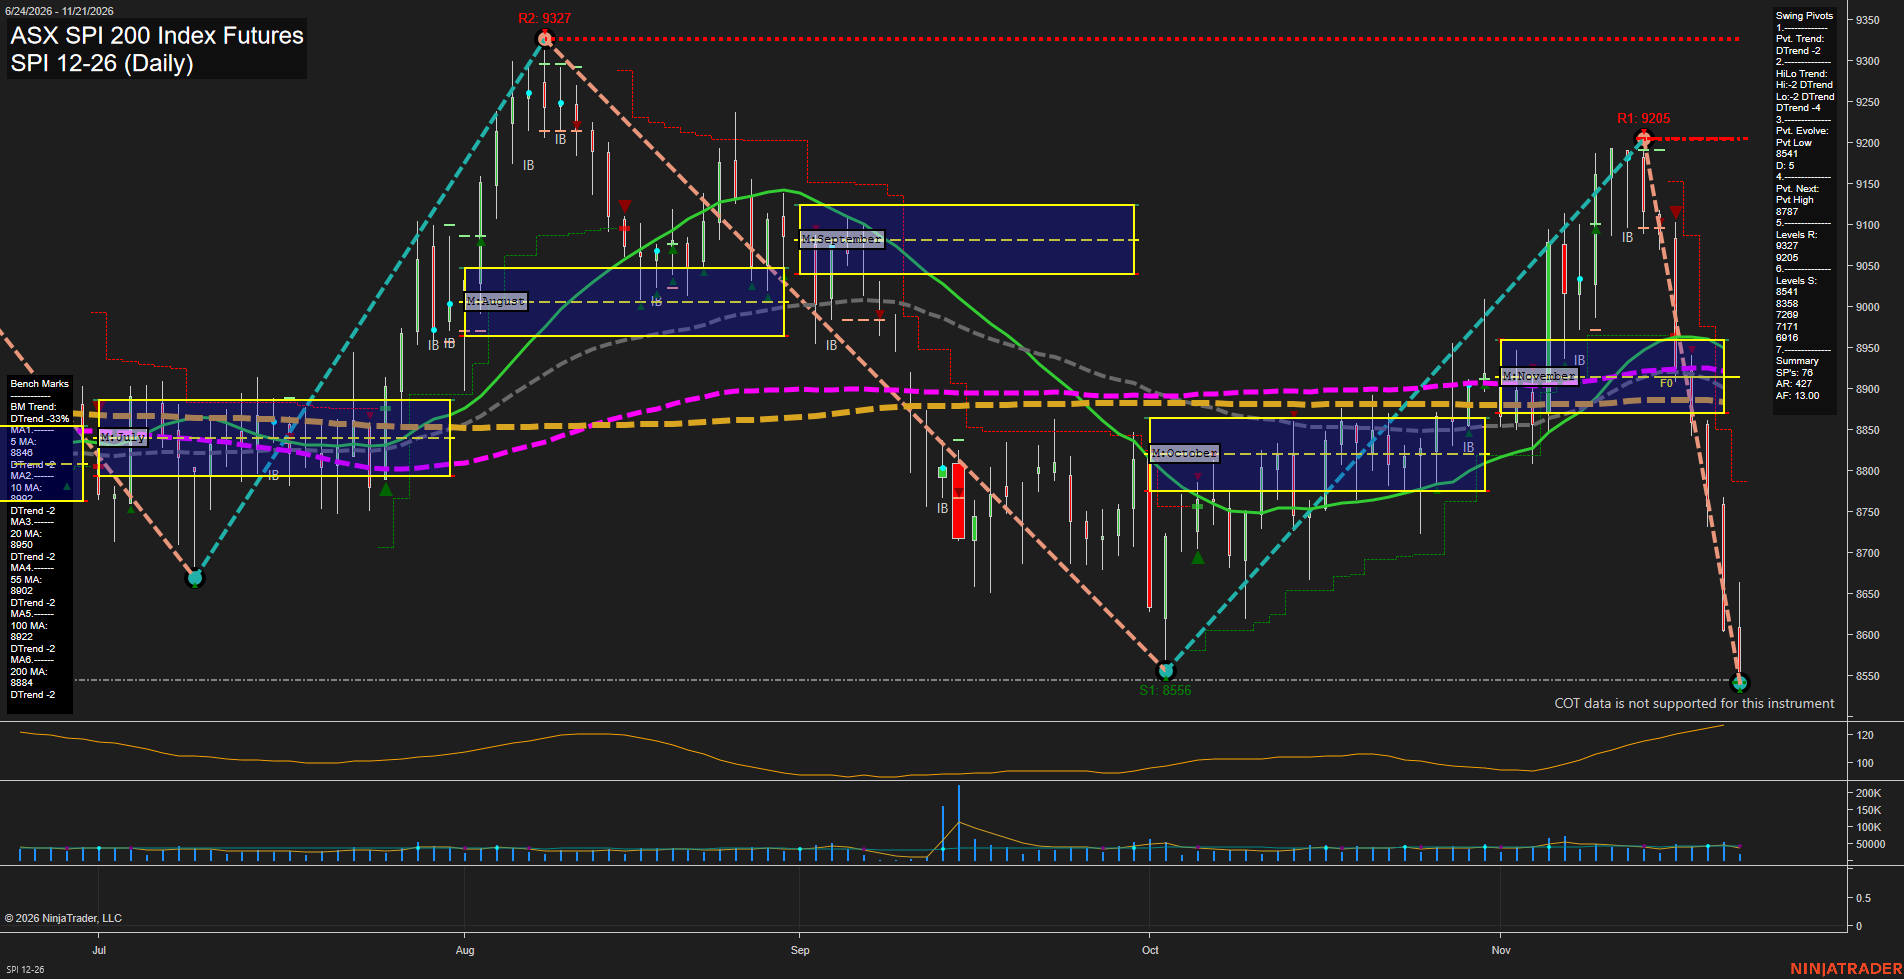
SPI ASX SPI 200 Index Futures Daily Chart Analysis — After Market Close: 2026-Nov-20 15:12 CT
Price Action
- Last: Approximately 8545,
- Bars: Large,
- Mom: Momentum fast.
WSFG Weekly
- Near-Term
- WSFG Current: NA%
- F0%/NTZ' Bias: Price Neutral,
- WSFG Trend: Neutral.
MSFG Month Nov
- Medium-Term
- MSFG Current: NA%
- F0%/NTZ' Bias: Price below F0% and NTZ,
- MSFG Trend: Bearish.
YSFG Year 2026
- Far-Term
- YSFG Current: NA%
- F0%/NTZ' Bias: Price Neutral,
- YSFG Trend: Neutral.
Swing Pivots
- (Near-Term) 1. Pvt. Trend: DTrend,
- (Medium-Term) 2. HiLo Trend: DTrend,
- 3. Pvt. Evolve: Pvt low 8541,
- 4. Pvt. Next: Pvt high 8787,
- 5. Levels R: 9327, 9205,
- 6. Levels S: 8541, 8358, 7269, 7171, 6916.
Daily Benchmarks
- (Near-Term) 5 Day: 8846 Down Trend,
- (Near-Term) 10 Day: 8992 Down Trend,
- (Medium-Term) 20 Day: 8950 Down Trend,
- (Medium-Term) 55 Day: 8902 Down Trend,
- (Far-Term) 100 Day: 8922 Down Trend,
- (Far-Term) 200 Day: 8884 Down Trend.
Additional Metrics
- ATR: Approximately 127,
- VOLMA: 45319.
Overall Rating
- Near-Term: Bearish,
- Medium-Term: Bearish,
- Far-Term: Bearish.
Key Insights Summary
The November rally has reversed sharply from 9205, producing a lower high beneath 9327 and a marginal lower low beneath October’s 8556 pivot. From a futures swing-trading perspective, this is a fast bearish reversal rather than an orderly pullback: large downside bars, rising ATR, and price below all six declining benchmarks indicate broad downside alignment. The evolving 8541 low is the immediate support reference, followed by 8358; 8787 is the summary’s next pivot-reversal threshold, not a confirmed resistance pivot. November’s NTZ, approximately 8870–8960, now sits well overhead. Volume has not matched September’s exceptional spike, so the decline is not visibly accompanied by comparable capitulation volume. Weekly and yearly grids and the named trade-signal series are not displayed; their neutral entries represent unavailable confirmation. No news or seasonal catalyst can be established from this chart alone.
Chart Analysis ATS AI Generated: 2026-11-20 15:12 for Informational use only, not trading advice. Terms and Risk Disclosure Copyright © 2026. Algo Trading Systems LLC.