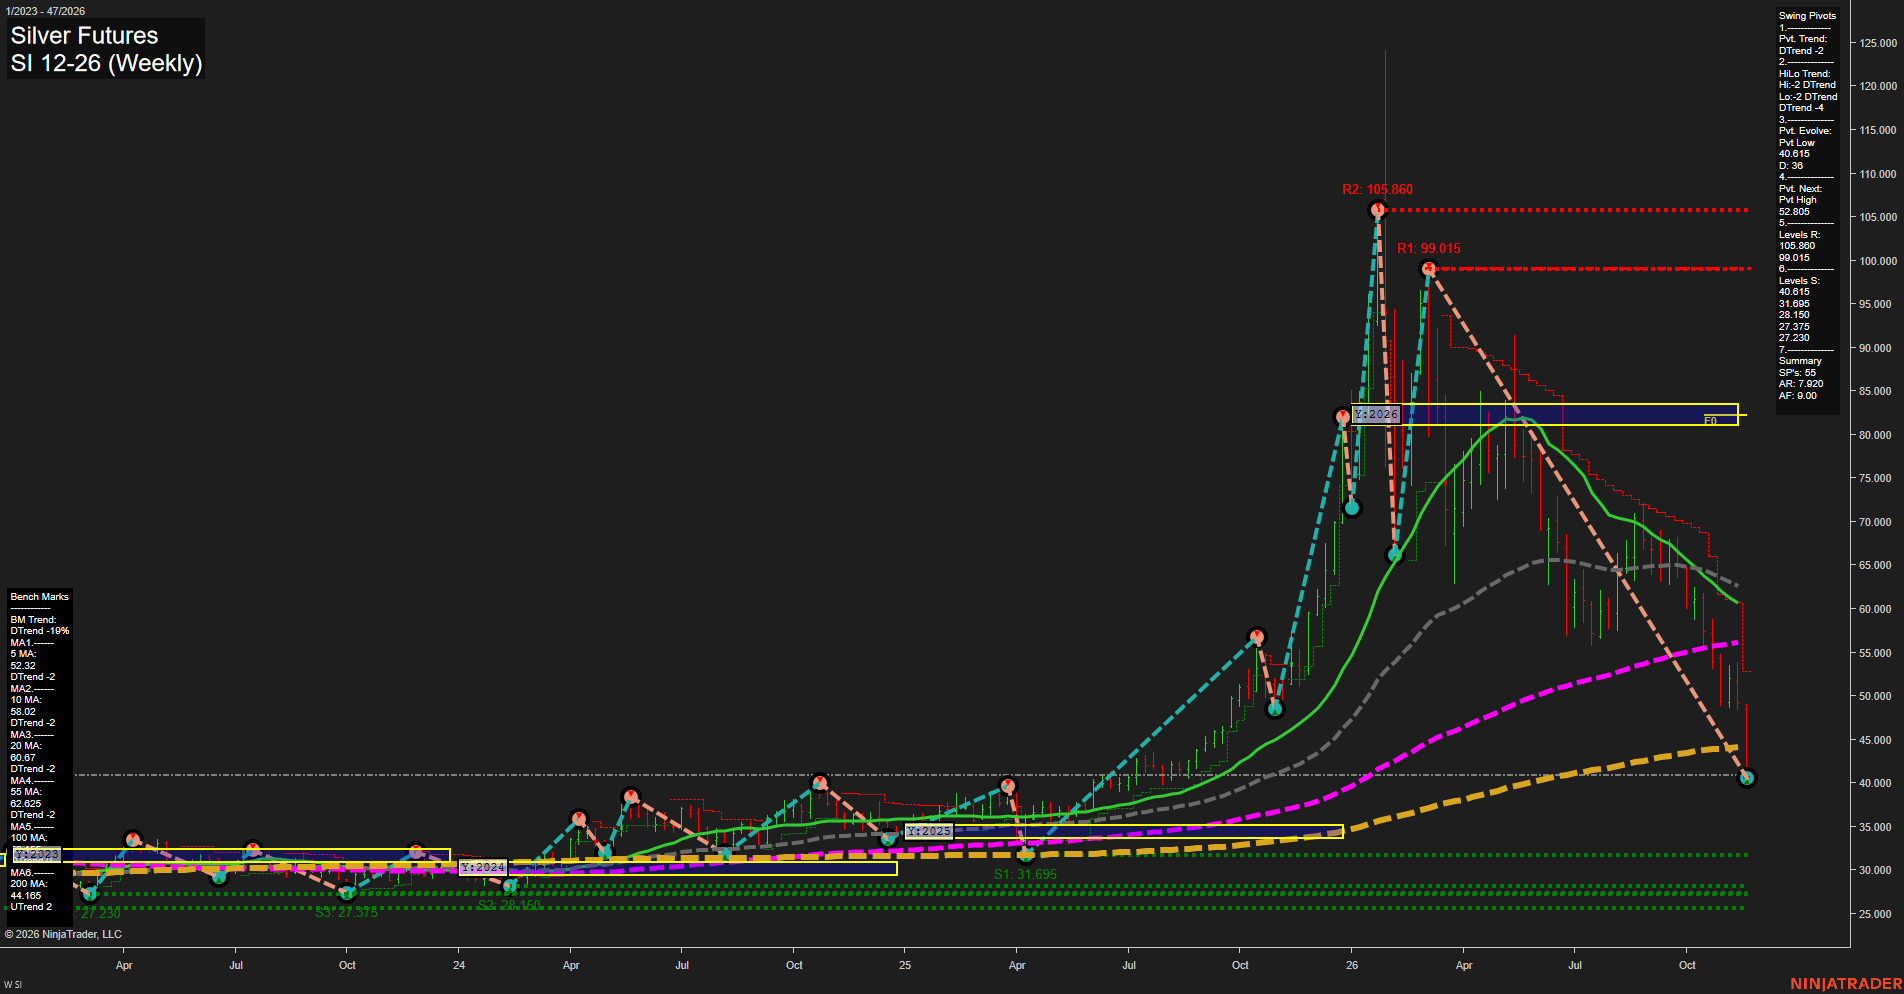
SI Silver Futures Weekly Chart Analysis — After Market Close: 2026-Nov-20 15:12 CT
Price Action
- Last: Approximately 41.000,
- Bars: Large,
- Mom: Fast downside momentum.
WSFG Weekly
- Near-Term
- WSFG Current: -144%
- F0%/NTZ' Bias: Price Below,
- WSFG Trend: Down.
MSFG Month Nov
- Medium-Term
- MSFG Current: -83%
- F0%/NTZ' Bias: Price Below,
- MSFG Trend: Down.
YSFG Year 2026
- Far-Term
- YSFG Current: -345%
- F0%/NTZ' Bias: Price Below,
- YSFG Trend: Down.
Swing Pivots
- (Near-Term) 1. Pvt. Trend: DTrend,
- (Medium-Term) 2. HiLo Trend: DTrend,
- 3. Pvt. Evolve: Pvt low 40.615,
- 4. Pvt. Next: Pvt high 52.805,
- 5. Levels R: 105.860, 99.015,
- 6. Levels S: 40.615, 31.695, 28.150, 27.375, 27.230.
Weekly Benchmarks
- (Near-Term) 5 Week: 52.32 Down Trend,
- (Near-Term) 10 Week: 58.02 Down Trend,
- (Medium-Term) 20 Week: 60.67 Down Trend,
- (Medium-Term) 55 Week: 62.625 Down Trend,
- (Far-Term) 100 Week: Approximately 56.3 Up Trend,
- (Far-Term) 200 Week: 44.165 Up Trend.
Recent Trade Signals
- 17 Nov 2026: Short SI 12-26 @ 47.515 Signals.USAR-WSFG
- 17 Nov 2026: Short SI 12-26 @ 47.425 Signals.USAR-MSFG
Overall Rating
- Near-Term: Bearish,
- Medium-Term: Bearish,
- Far-Term: Bearish.
Key Insights Summary
Silver’s weekly structure shows a sustained bearish reversal following the sharp advance and subsequent lower high at 99.015 versus 105.860. Large downside bars and the developing pivot low at 40.615 indicate persistent selling pressure rather than a confirmed base. Price is below all six weekly benchmarks, including the still-rising 100- and 200-week averages, distinguishing current price weakness from lagging longer-term trend measures. Near- and medium-term pivot trends, all three supplied session-grid readings, and the November short signals reinforce the bearish alignment. The 40.615 pivot is the nearest support reference, followed by 31.695; 52.805 is the summary’s next opposite-pivot reversal threshold, not an established resistance pivot. Far-term conditions are rated bearish despite rising longer-term averages because price has fallen below them and remains deeply below the yearly neutral zone. The chart alone does not establish a news or seasonal explanation for the decline.
Chart Analysis ATS AI Generated: 2026-11-20 15:12 for Informational use only, not trading advice. Terms and Risk Disclosure Copyright © 2026. Algo Trading Systems LLC.