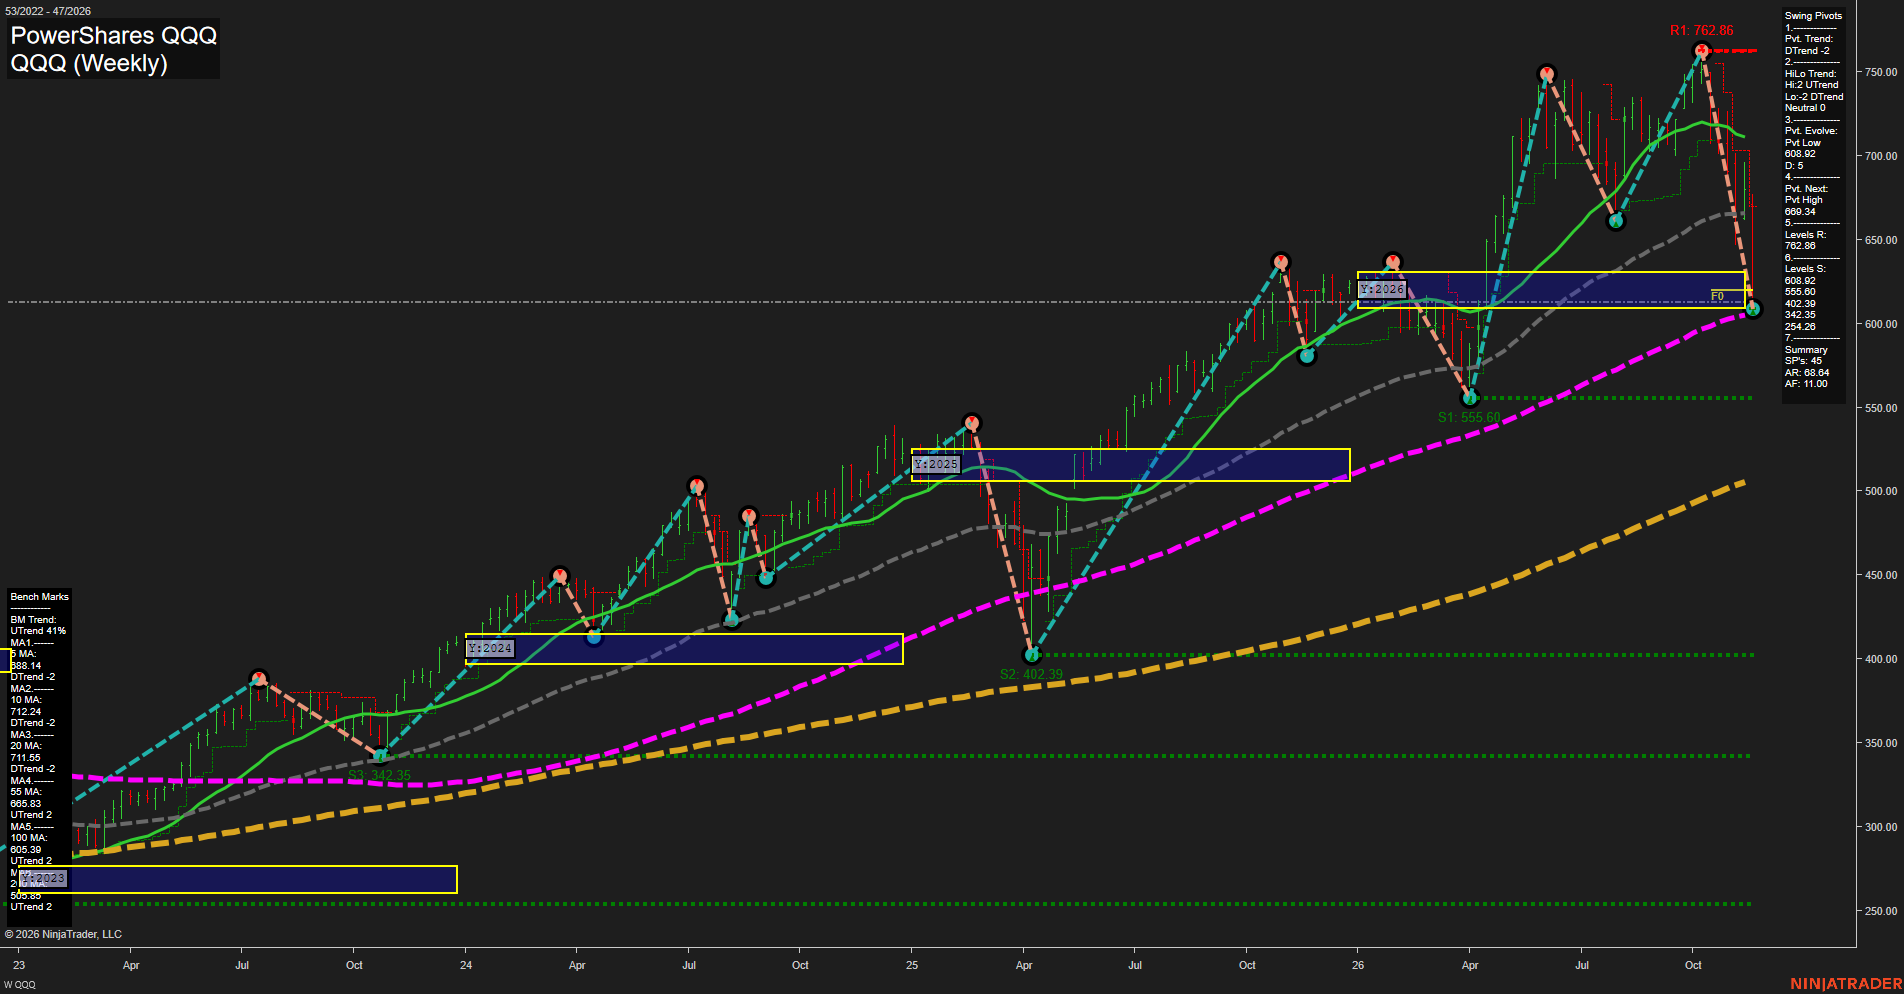
QQQ PowerShares QQQ Weekly Chart Analysis — After Market Close: 2026-Nov-20 15:11 CT
Price Action
- Last: approximately 613,
- Bars: Large,
- Mom: Momentum fast.
WSFG Weekly
- Near-Term
- WSFG Current: NA%
- F0%/NTZ' Bias: Price Neutral,
- WSFG Trend: Neutral.
MSFG Month Nov
- Medium-Term
- MSFG Current: NA%
- F0%/NTZ' Bias: Price Neutral,
- MSFG Trend: Neutral.
YSFG Year 2026
- Far-Term
- YSFG Current: NA%
- F0%/NTZ' Bias: Price Neutral,
- YSFG Trend: Neutral.
Swing Pivots
- (Near-Term) 1. Pvt. Trend: DTrend,
- (Medium-Term) 2. HiLo Trend: Neutral, mixed higher highs and lower lows,
- 3. Pvt. Evolve: Pvt low 608.92,
- 4. Pvt. Next: Pvt high 669.34,
- 5. Levels R: 762.86,
- 6. Levels S: 608.92, 555.60, 402.39, 342.35, 254.26.
Weekly Benchmarks
- (Near-Term) 5 Week: 688.14 Down Trend,
- (Near-Term) 10 Week: 712.24 Down Trend,
- (Medium-Term) 20 Week: 711.55 Down Trend,
- (Medium-Term) 55 Week: 665.83 Up Trend,
- (Far-Term) 100 Week: 605.39 Up Trend,
- (Far-Term) 200 Week: approximately 505.83 Up Trend.
Overall Rating
- Near-Term: Bearish,
- Medium-Term: Bearish,
- Far-Term: Bullish.
Key Insights Summary
From a futures swing trader's perspective, QQQ shows a fast downside swing within a still-rising long-term structure, rather than a confirmed broad trend reversal. The decline from 762.86 has broken beneath the 5-, 10-, 20- and 55-week benchmarks, leaving price near the lower boundary of the 2026 yearly neutral zone and the rising 100-week average. The 608.92 evolving pivot and 605.39 benchmark form a concentrated support area; 555.60 is the next listed support below it. The pivot summary identifies 669.34 as the reversal threshold for an opposite pivot, not an established resistance level. Mixed higher highs and lower lows indicate expanding medium-term volatility rather than an orderly trend. The far-term bullish rating reflects rising 100- and 200-week benchmarks, while near- and medium-term conditions remain bearish. Weekly and monthly grids and the requested USAR signals are not visible, so their neutral entries are placeholders rather than verified signals. QQQ levels describe the ETF and are not directly transferable to Nasdaq futures prices; no news or seasonal catalyst is established by this chart.
Chart Analysis ATS AI Generated: 2026-11-20 15:11 for Informational use only, not trading advice. Terms and Risk Disclosure Copyright © 2026. Algo Trading Systems LLC.