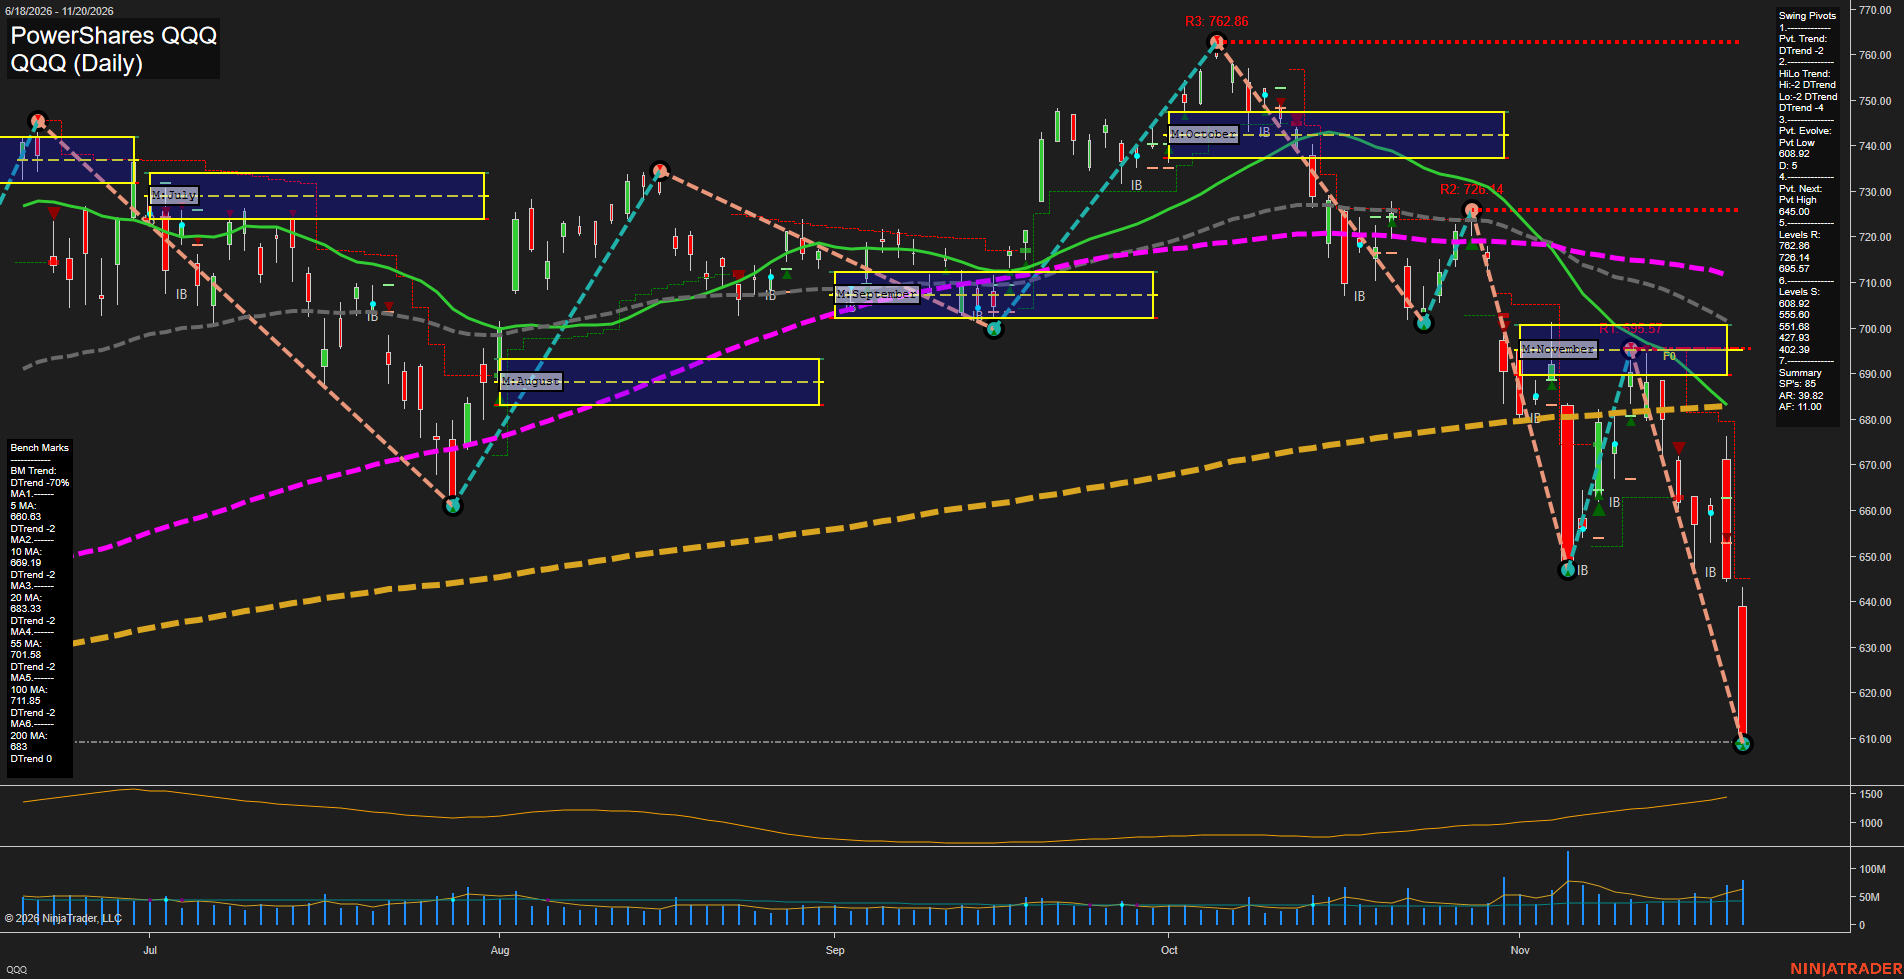
QQQ PowerShares QQQ Daily Chart Analysis — After Market Close: 2026-Nov-20 15:10 CT
Price Action
- Last: approximately 608.92,
- Bars: Large,
- Mom: Momentum fast.
WSFG Weekly
- Near-Term
- WSFG Current: NA%
- F0%/NTZ' Bias: Not visible,
- WSFG Trend: Not available.
MSFG Month Nov
- Medium-Term
- MSFG Current: NA%
- F0%/NTZ' Bias: Price below F0% and NTZ,
- MSFG Trend: Bearish.
YSFG Year 2026
- Far-Term
- YSFG Current: NA%
- F0%/NTZ' Bias: Not visible,
- YSFG Trend: Not available.
Swing Pivots
- (Near-Term) 1. Pvt. Trend: DTrend,
- (Medium-Term) 2. HiLo Trend: DTrend,
- 3. Pvt. Evolve: Pvt low 608.92,
- 4. Pvt. Next: Pvt high 645.00,
- 5. Levels R: 762.86, 726.14, 695.57,
- 6. Levels S: 608.92, 555.60, 551.68, 427.93, 402.39.
Daily Benchmarks
- (Near-Term) 5 Day: 660.63 Down Trend,
- (Near-Term) 10 Day: 669.19 Down Trend,
- (Medium-Term) 20 Day: 683.33 Down Trend,
- (Medium-Term) 55 Day: 701.58 Down Trend,
- (Far-Term) 100 Day: 711.85 Down Trend,
- (Far-Term) 200 Day: 683.00 Flat Trend.
Additional Metrics
- ATR: approximately 1450 on the displayed indicator scale,
- VOLMA: approximately 65000000.
Overall Rating
- Near-Term: Bearish,
- Medium-Term: Bearish,
- Far-Term: Bearish.
Key Insights Summary
From a futures swing trader’s perspective, this QQQ chart depicts an accelerating Nasdaq-related downside impulse, not a normal shallow retracement. Successive lower highs and lower lows culminate in a large bearish bar finishing near the evolving 608.92 pivot low. The rebound to 695.57 failed, followed by a break beneath the previous November low near 647. Price is below every benchmark, including the approximately 683 long-term average, while the November neutral zone near 690–701 sits substantially overhead. Rising ATR and heavier recent volume indicate expanding volatility and stronger selling participation. The 645.00 next-pivot threshold is a structural reversal reference, not confirmation of an established uptrend. Far-term conditions are bearish despite the still-flat 200-day benchmark. QQQ levels are ETF reference prices rather than executable Nasdaq futures levels; futures basis and session differences matter. Weekly/yearly grids and the named USAR signals are not visible, and no news catalyst can be established from this chart.
Chart Analysis ATS AI Generated: 2026-11-20 15:11 for Informational use only, not trading advice. Terms and Risk Disclosure Copyright © 2026. Algo Trading Systems LLC.