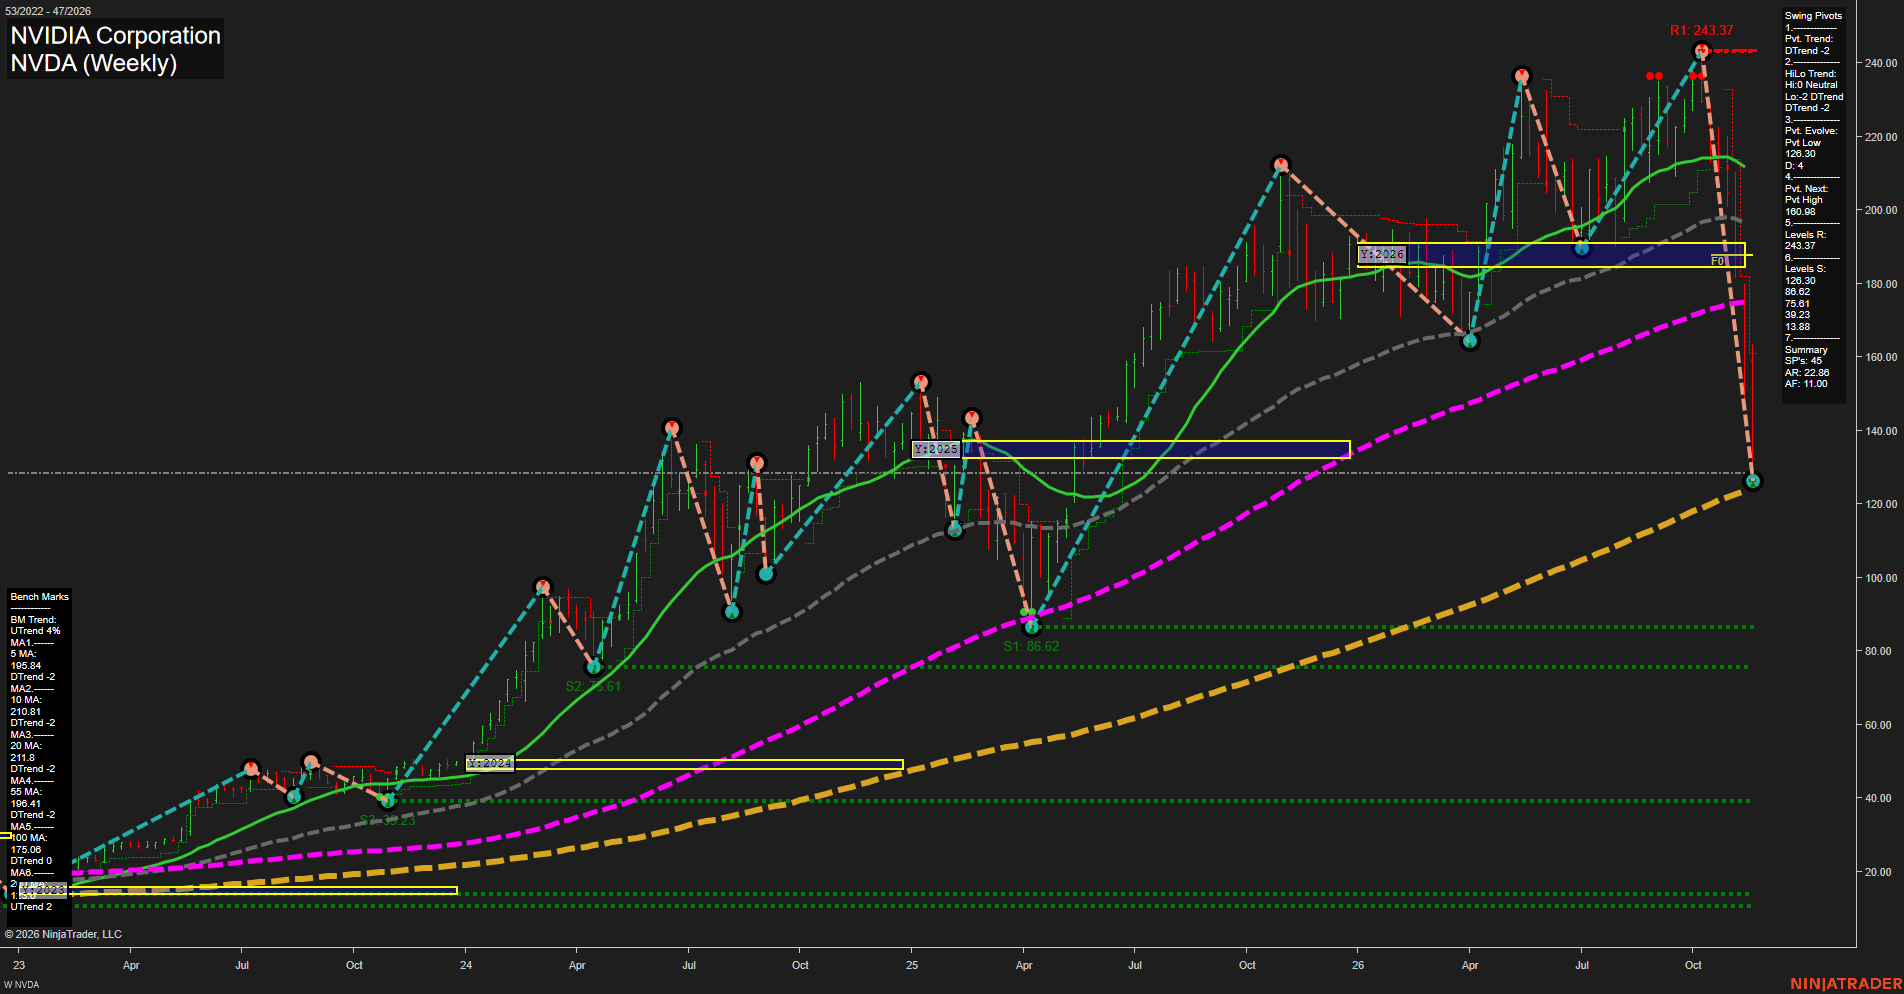
NVDA NVIDIA Corporation Weekly Chart Analysis — After Market Close: 2026-Nov-20 15:10 CT
Price Action
- Last: Approximately 128,
- Bars: Large,
- Mom: Momentum fast.
WSFG Weekly
- Near-Term
- WSFG Current: NA%
- F0%/NTZ' Bias: Price Neutral,
- WSFG Trend: Neutral.
MSFG Month Nov
- Medium-Term
- MSFG Current: NA%
- F0%/NTZ' Bias: Price Neutral,
- MSFG Trend: Neutral.
YSFG Year 2026
- Far-Term
- YSFG Current: NA%
- F0%/NTZ' Bias: Price Neutral,
- YSFG Trend: Neutral.
Swing Pivots
- (Near-Term) 1. Pvt. Trend: DTrend,
- (Medium-Term) 2. HiLo Trend: DTrend,
- 3. Pvt. Evolve: Pvt low 126.30,
- 4. Pvt. Next: Pvt high 160.98,
- 5. Levels R: 243.37,
- 6. Levels S: 126.30, 86.62, 75.61, 39.23, 13.88.
Weekly Benchmarks
- (Near-Term) 5 Week: 195.84 Down Trend,
- (Near-Term) 10 Week: 210.81 Down Trend,
- (Medium-Term) 20 Week: 211.80 Down Trend,
- (Medium-Term) 55 Week: 196.41 Down Trend,
- (Far-Term) 100 Week: 175.06 Down Trend,
- (Far-Term) 200 Week: Approximately 124 Up Trend.
Overall Rating
- Near-Term: Bearish,
- Medium-Term: Bearish,
- Far-Term: Neutral.
Key Insights Summary
From a futures swing trader’s perspective, this equity chart shows a fast downside expansion rather than an orderly pullback. The decline from 243.37 to the evolving 126.30 pivot represents approximately 48% peak-to-trough compression, with price below the 5-, 10-, 20-, 55- and 100-week benchmarks. Both pivot trends are bearish; 160.98 is the displayed opposite-pivot reversal threshold, not a confirmed recovery. The remaining rising 200-week benchmark sits near current price, placing the selloff at a major long-term trend reference. Although the required session-grid fields above are neutral placeholders, the visible yearly grid near 185–191 is above price, indicating a bearish positional relationship. Weekly and monthly grids and the requested recent signal series are not visible, so their directional confirmation cannot be established. The image is an NVDA equity chart, not a futures contract; contract volume, open interest, basis and rollover effects are unavailable. News and seasonal explanations are likewise not established by the image.
Chart Analysis ATS AI Generated: 2026-11-20 15:10 for Informational use only, not trading advice. Terms and Risk Disclosure Copyright © 2026. Algo Trading Systems LLC.