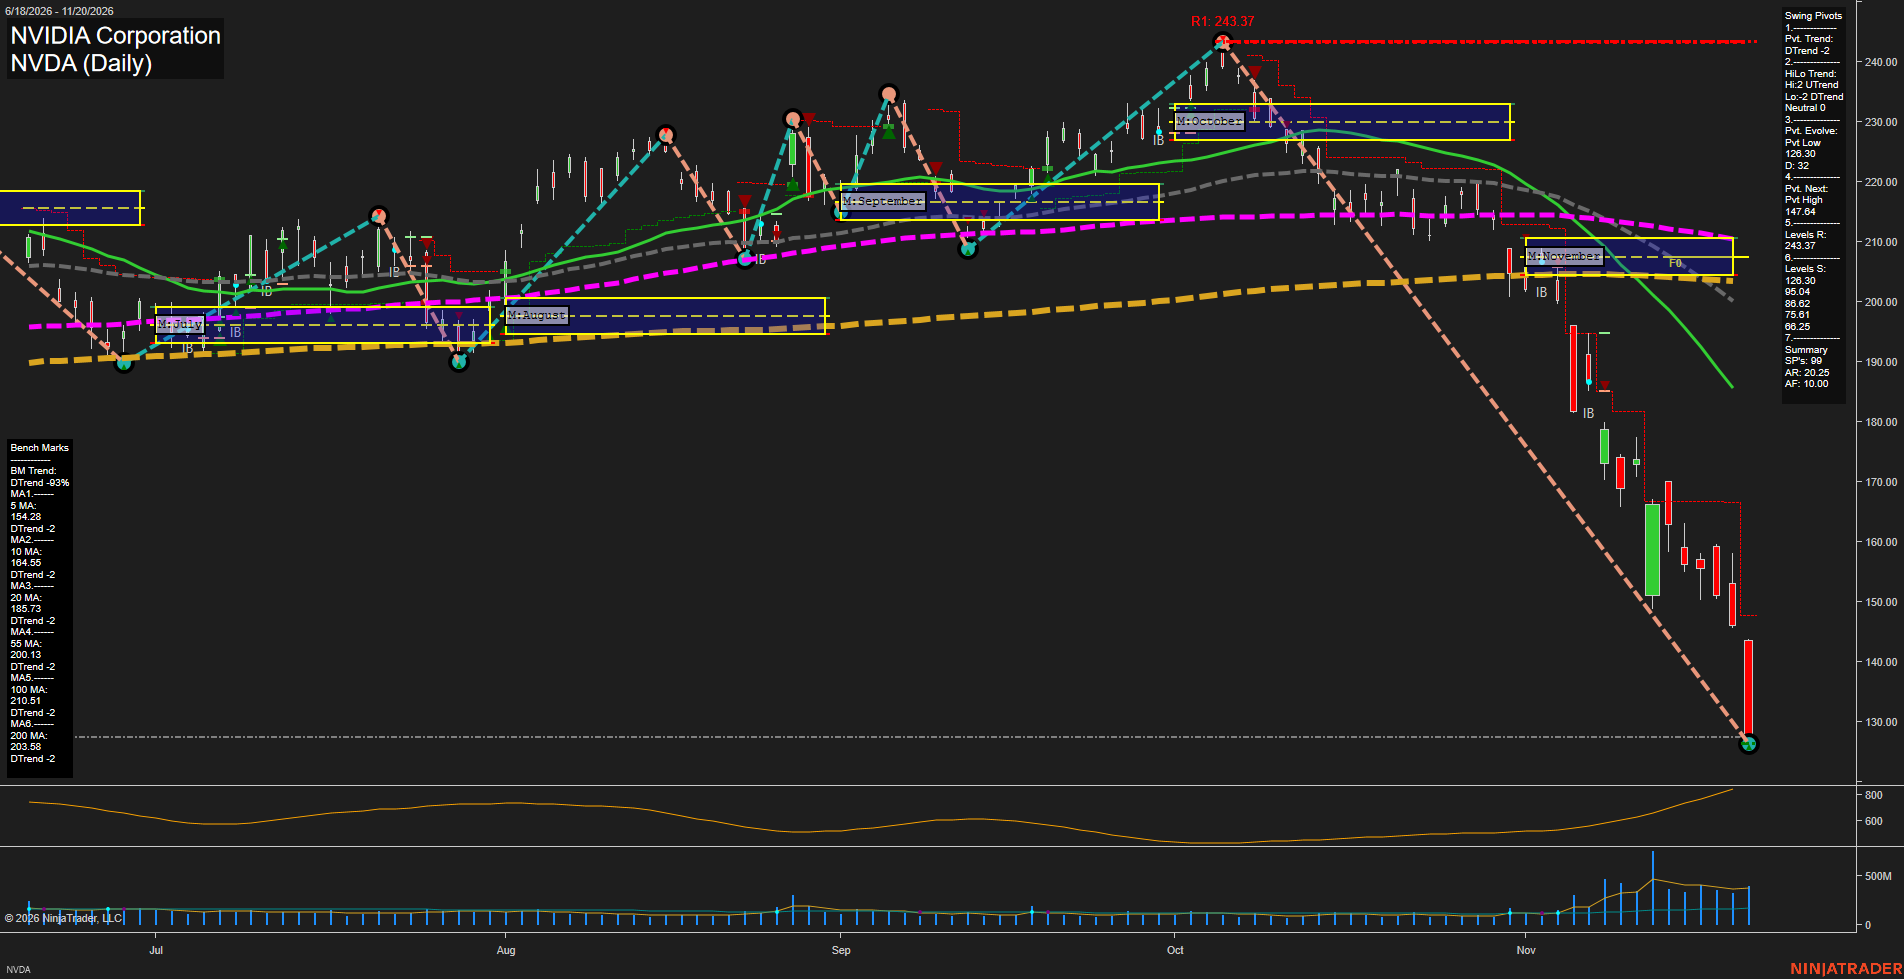
NVDA NVIDIA Corporation Daily Chart Analysis — After Market Close: 2026-Nov-20 15:10 CT
Price Action
- Last: Approximately 127.50,
- Bars: Large,
- Mom: Momentum fast to the downside.
WSFG Weekly
- Near-Term
- WSFG Current: NA%
- F0%/NTZ' Bias: Price Neutral, unavailable on chart,
- WSFG Trend: Neutral.
MSFG Month Nov
- Medium-Term
- MSFG Current: NA%
- F0%/NTZ' Bias: Price Bearish, below F0% and NTZ,
- MSFG Trend: Bearish.
YSFG Year 2026
- Far-Term
- YSFG Current: NA%
- F0%/NTZ' Bias: Price Neutral, unavailable on chart,
- YSFG Trend: Neutral.
Swing Pivots
- (Near-Term) 1. Pvt. Trend: DTrend,
- (Medium-Term) 2. HiLo Trend: Neutral, with high pivots UTrend and low pivots DTrend,
- 3. Pvt. Evolve: Pvt low 126.30,
- 4. Pvt. Next: Pvt high 147.64,
- 5. Levels R: 243.37,
- 6. Levels S: 126.30, 95.04, 88.62, 75.61, 66.25.
Daily Benchmarks
- (Near-Term) 5 Day: 154.28 Down Trend,
- (Near-Term) 10 Day: 164.55 Down Trend,
- (Medium-Term) 20 Day: 185.73 Down Trend,
- (Medium-Term) 55 Day: 200.13 Down Trend,
- (Far-Term) 100 Day: 210.51 Down Trend,
- (Far-Term) 200 Day: 203.58 Down Trend.
Additional Metrics
- ATR: Approximately 850,
- VOLMA: 346637249.
Overall Rating
- Near-Term: Bearish,
- Medium-Term: Bearish,
- Far-Term: Bearish.
Key Insights Summary
From a futures swing-trading perspective, this equity chart shows an accelerating downside impulse rather than an orderly retracement. Price has fallen approximately 48% from the 243.37 swing high, with large bearish bars, expanding ATR and elevated volume indicating substantial volatility expansion. Recent rebounds have failed to interrupt the decline, and price remains below all six falling benchmarks and November’s approximately 204–211 monthly neutral zone. The evolving 126.30 pivot low is the nearest listed support; 147.64 is the summary’s opposite-pivot reversal threshold, not a confirmed resistance pivot. Although the HiLo summary remains mixed, the active downswing and benchmark alignment support bearish ratings across all three horizons. Weekly and yearly grids and the named trade-signal series are not displayed; news and seasonal explanations cannot be established from this image. ATR is reported in the indicator’s displayed units, not assumed to be dollar points.
Chart Analysis ATS AI Generated: 2026-11-20 15:10 for Informational use only, not trading advice. Terms and Risk Disclosure Copyright © 2026. Algo Trading Systems LLC.