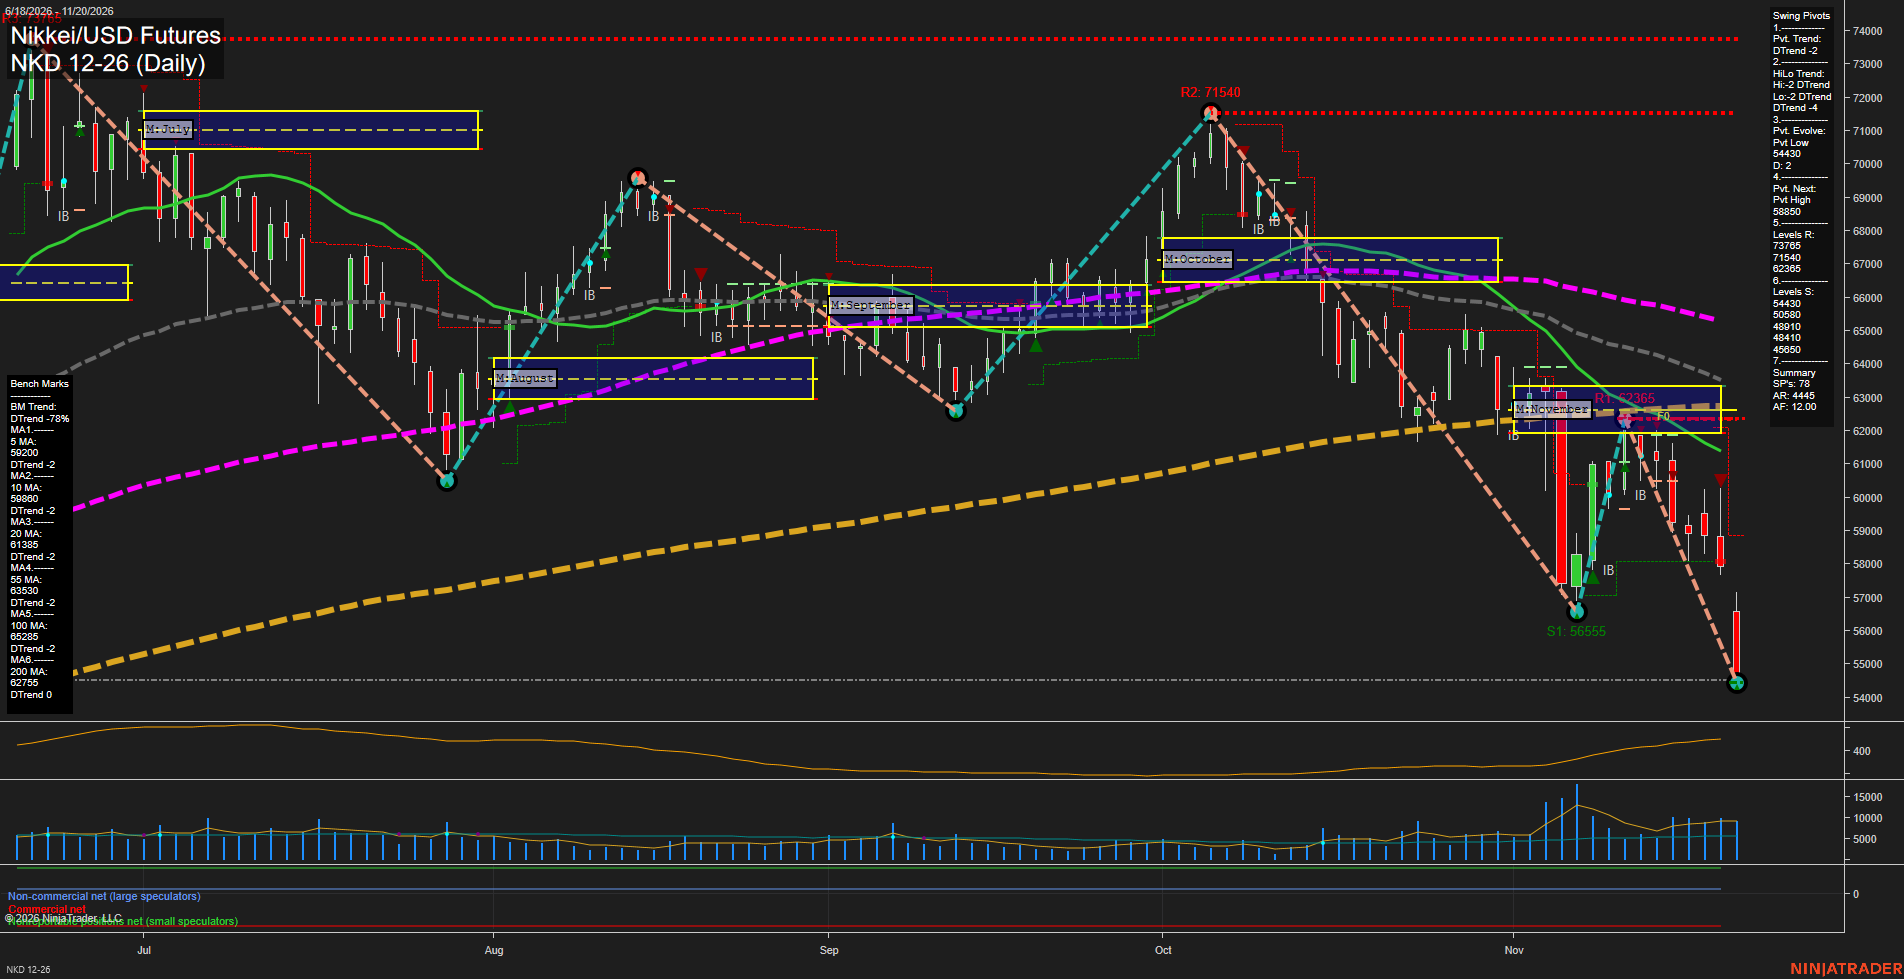
NKD Nikkei/USD Futures Daily Chart Analysis — After Market Close: 2026-Nov-20 15:09 CT
Price Action
- Last: Approximately 54,500,
- Bars: Large,
- Mom: Momentum fast.
WSFG Weekly
- Near-Term
- WSFG Current: -137%
- F0%/NTZ' Bias: Price Below,
- WSFG Trend: Down.
MSFG Month Nov
- Medium-Term
- MSFG Current: -109%
- F0%/NTZ' Bias: Price Below,
- MSFG Trend: Down.
YSFG Year 2026
- Far-Term
- YSFG Current: 45%
- F0%/NTZ' Bias: Price Above,
- YSFG Trend: Up.
Swing Pivots
- (Near-Term) 1. Pvt. Trend: DTrend,
- (Medium-Term) 2. HiLo Trend: DTrend,
- 3. Pvt. Evolve: Pvt low 54,430,
- 4. Pvt. Next: Pvt high 58,850,
- 5. Levels R: 73,765, 71,540, 62,365,
- 6. Levels S: 54,430, 50,580, 48,910, 48,410, 45,650.
Daily Benchmarks
- (Near-Term) 5 Day: 59,200 Down Trend,
- (Near-Term) 10 Day: 59,860 Down Trend,
- (Medium-Term) 20 Day: 61,385 Down Trend,
- (Medium-Term) 55 Day: 63,530 Down Trend,
- (Far-Term) 100 Day: 65,285 Down Trend,
- (Far-Term) 200 Day: 62,755 Down Trend.
Additional Metrics
Overall Rating
- Near-Term: Bearish,
- Medium-Term: Bearish,
- Far-Term: Bearish.
Key Insights Summary
From a futures swing trader’s perspective, the chart shows an accelerating bearish continuation rather than a routine pullback. The rebound from 56,555 failed at the lower swing high of 62,365 near November’s NTZ, followed by a fresh low at 54,430. The large final bearish candle closes near its low, reinforcing downside momentum. Price is below all six benchmarks, while weekly and monthly grid readings confirm substantial downside extension. The developing pivot low remains provisional; the summary identifies 58,850 as the next opposite-pivot reversal threshold. Far-term evidence is mixed, but declining long-term benchmarks outweigh the positive yearly grid reading. Rising charted volatility accompanies the selloff. The specified USAR signal readings are not visible, and the chart alone does not establish news or seasonal drivers.
Chart Analysis ATS AI Generated: 2026-11-20 15:09 for Informational use only, not trading advice. Terms and Risk Disclosure Copyright © 2026. Algo Trading Systems LLC.