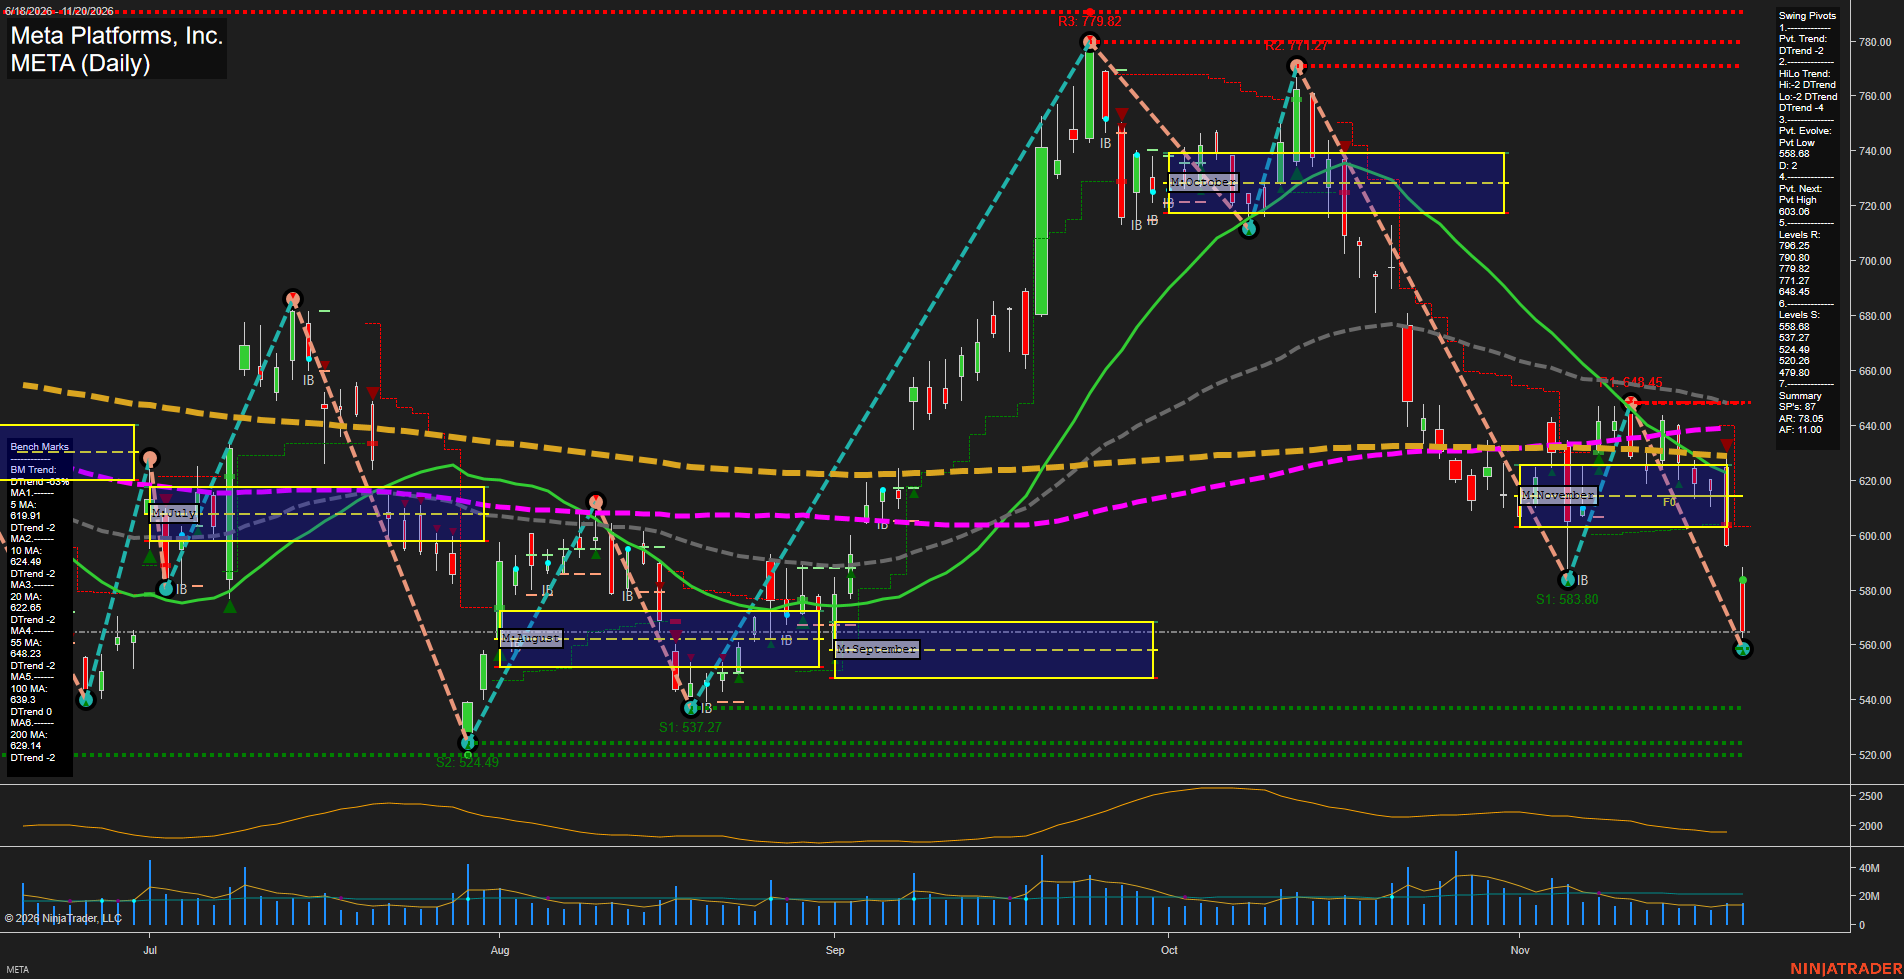
META Meta Platforms; Inc. Daily Chart Analysis — After Market Close: 2026-Nov-20 15:08 CT
Price Action
- Last: Approximately 565,
- Bars: Large,
- Mom: Momentum fast.
WSFG Weekly
- Near-Term
- WSFG Current: NA%
- F0%/NTZ' Bias: Not available,
- WSFG Trend: Not available.
MSFG Month Nov
- Medium-Term
- MSFG Current: NA%
- F0%/NTZ' Bias: Price Bearish,
- MSFG Trend: Bearish.
YSFG Year 2026
- Far-Term
- YSFG Current: NA%
- F0%/NTZ' Bias: Not available,
- YSFG Trend: Not available.
Swing Pivots
- (Near-Term) 1. Pvt. Trend: DTrend,
- (Medium-Term) 2. HiLo Trend: DTrend,
- 3. Pvt. Evolve: Pvt low 558.68,
- 4. Pvt. Next: Pvt high 603.06,
- 5. Levels R: 796.25, 790.80, 779.82, 771.27, 648.45,
- 6. Levels S: 558.68, 537.27, 524.49, 520.26, 479.80.
Daily Benchmarks
- (Near-Term) 5 Day: 619.91 Down Trend,
- (Near-Term) 10 Day: 624.49 Down Trend,
- (Medium-Term) 20 Day: 622.65 Down Trend,
- (Medium-Term) 55 Day: 648.23 Down Trend,
- (Far-Term) 100 Day: 639.30 Down Trend,
- (Far-Term) 200 Day: 629.14 Down Trend.
Additional Metrics
- ATR: 2162,
- VOLMA: 26211336.
Overall Rating
- Near-Term: Bearish,
- Medium-Term: Bearish,
- Far-Term: Bearish.
Key Insights Summary
From a futures swing trader’s perspective, META shows aligned bearish directional structure across all three horizons, although this is an equity chart rather than a futures contract. The rebound from 583.80 failed at 648.45, establishing a lower high before renewed selling produced a lower low at 558.68. Price is below every benchmark and beneath November’s approximately 603–626 no-trade zone, consistent with downside continuation rather than a confirmed reversal. The developing pivot low remains unconfirmed as a reversal; the summary identifies 603.06 as the next opposite-pivot threshold. The latest large downside bar indicates accelerating selling, while ATR has eased from its earlier peak and volume does not visibly establish a climactic washout. Weekly and yearly grids and the named USAR signal readings are not displayed, so their direction cannot be verified. News catalysts and seasonal effects cannot be established from this chart alone.
Chart Analysis ATS AI Generated: 2026-11-20 15:08 for Informational use only, not trading advice. Terms and Risk Disclosure Copyright © 2026. Algo Trading Systems LLC.