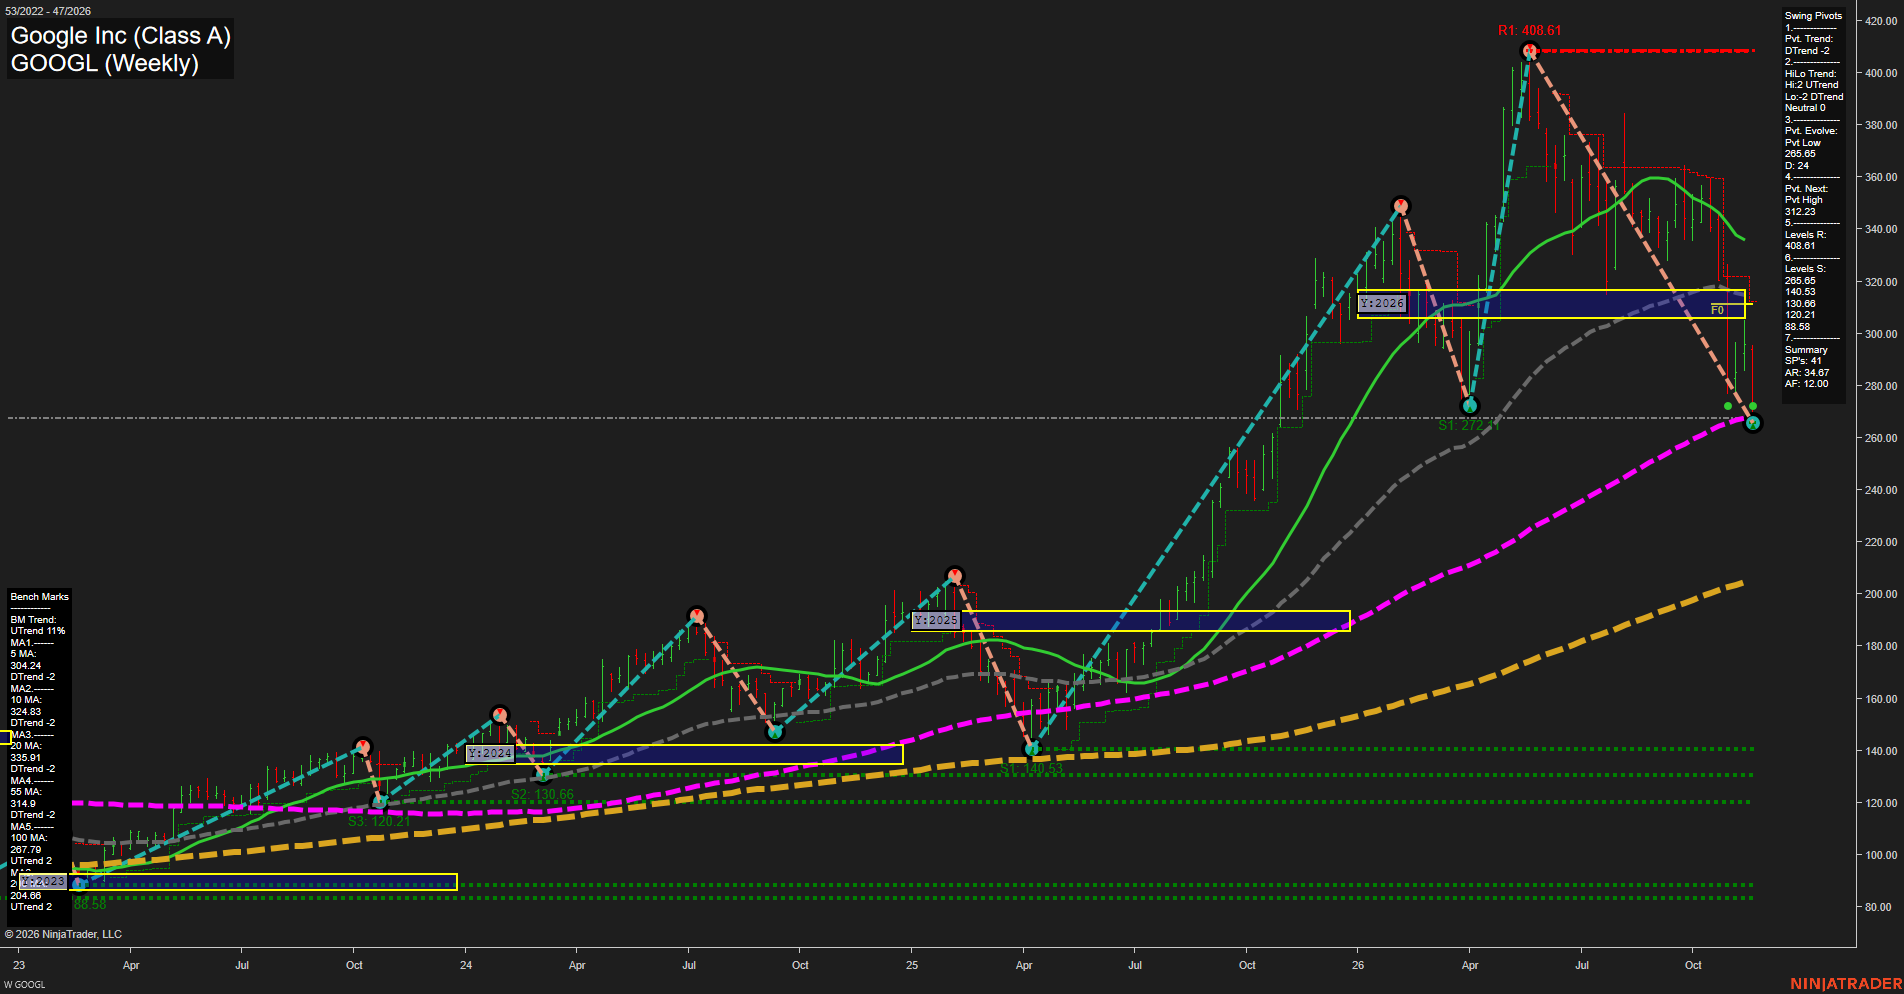
GOOGL Google Inc (Class A) Weekly Chart Analysis — After Market Close: 2026-Nov-20 15:07 CT
Price Action
- Last: Approximately 268,
- Bars: Large,
- Mom: Momentum fast to the downside.
WSFG Weekly
- Near-Term
- WSFG Current: NA%
- F0%/NTZ' Bias: Not displayed,
- WSFG Trend: Not assessable.
MSFG Month Nov
- Medium-Term
- MSFG Current: NA%
- F0%/NTZ' Bias: Not displayed,
- MSFG Trend: Not assessable.
YSFG Year 2026
- Far-Term
- YSFG Current: NA%
- F0%/NTZ' Bias: Price below F0% and NTZ,
- YSFG Trend: Bearish.
Swing Pivots
- (Near-Term) 1. Pvt. Trend: DTrend,
- (Medium-Term) 2. HiLo Trend: Neutral,
- 3. Pvt. Evolve: Pvt low 265.65,
- 4. Pvt. Next: Pvt high 312.23,
- 5. Levels R: 408.61,
- 6. Levels S: 265.65, 140.53, 130.66, 120.21, 88.58.
Weekly Benchmarks
- (Near-Term) 5 Week: 304.24 Down Trend,
- (Near-Term) 10 Week: 324.83 Down Trend,
- (Medium-Term) 20 Week: 335.91 Down Trend,
- (Medium-Term) 55 Week: 314.9 Down Trend,
- (Far-Term) 100 Week: 267.79 Up Trend,
- (Far-Term) 200 Week: 204.86 Up Trend.
Overall Rating
- Near-Term: Bearish,
- Medium-Term: Bearish,
- Far-Term: Neutral.
Key Insights Summary
From a futures swing trader’s perspective, this equity chart shows a fast corrective downswing rather than an established reversal higher. Price has declined approximately 34% from 408.61, undercut the prior 272.11 swing low, and reached the rising 100-week benchmark near 267.79. Large recent weekly ranges reflect elevated volatility and directional selling pressure. The near-term pivot trend is down; the medium-term HiLo summary is neutral because higher highs coexist with lower lows. Price below the declining 5-, 10-, 20- and 55-week benchmarks reinforces the bearish near- and medium-term assessment. The 2026 NTZ around 306–317 is now overhead, while 312.23 is the summary’s next pivot reversal threshold, not a confirmed high. Rising 100- and 200-week averages preserve a longer-term bullish backdrop, but the yearly-grid breakdown makes the far-term picture mixed. Weekly and monthly grids and the specified recent trade signals are not displayed; news and seasonal explanations cannot be established from this chart.
Chart Analysis ATS AI Generated: 2026-11-20 15:08 for Informational use only, not trading advice. Terms and Risk Disclosure Copyright © 2026. Algo Trading Systems LLC.