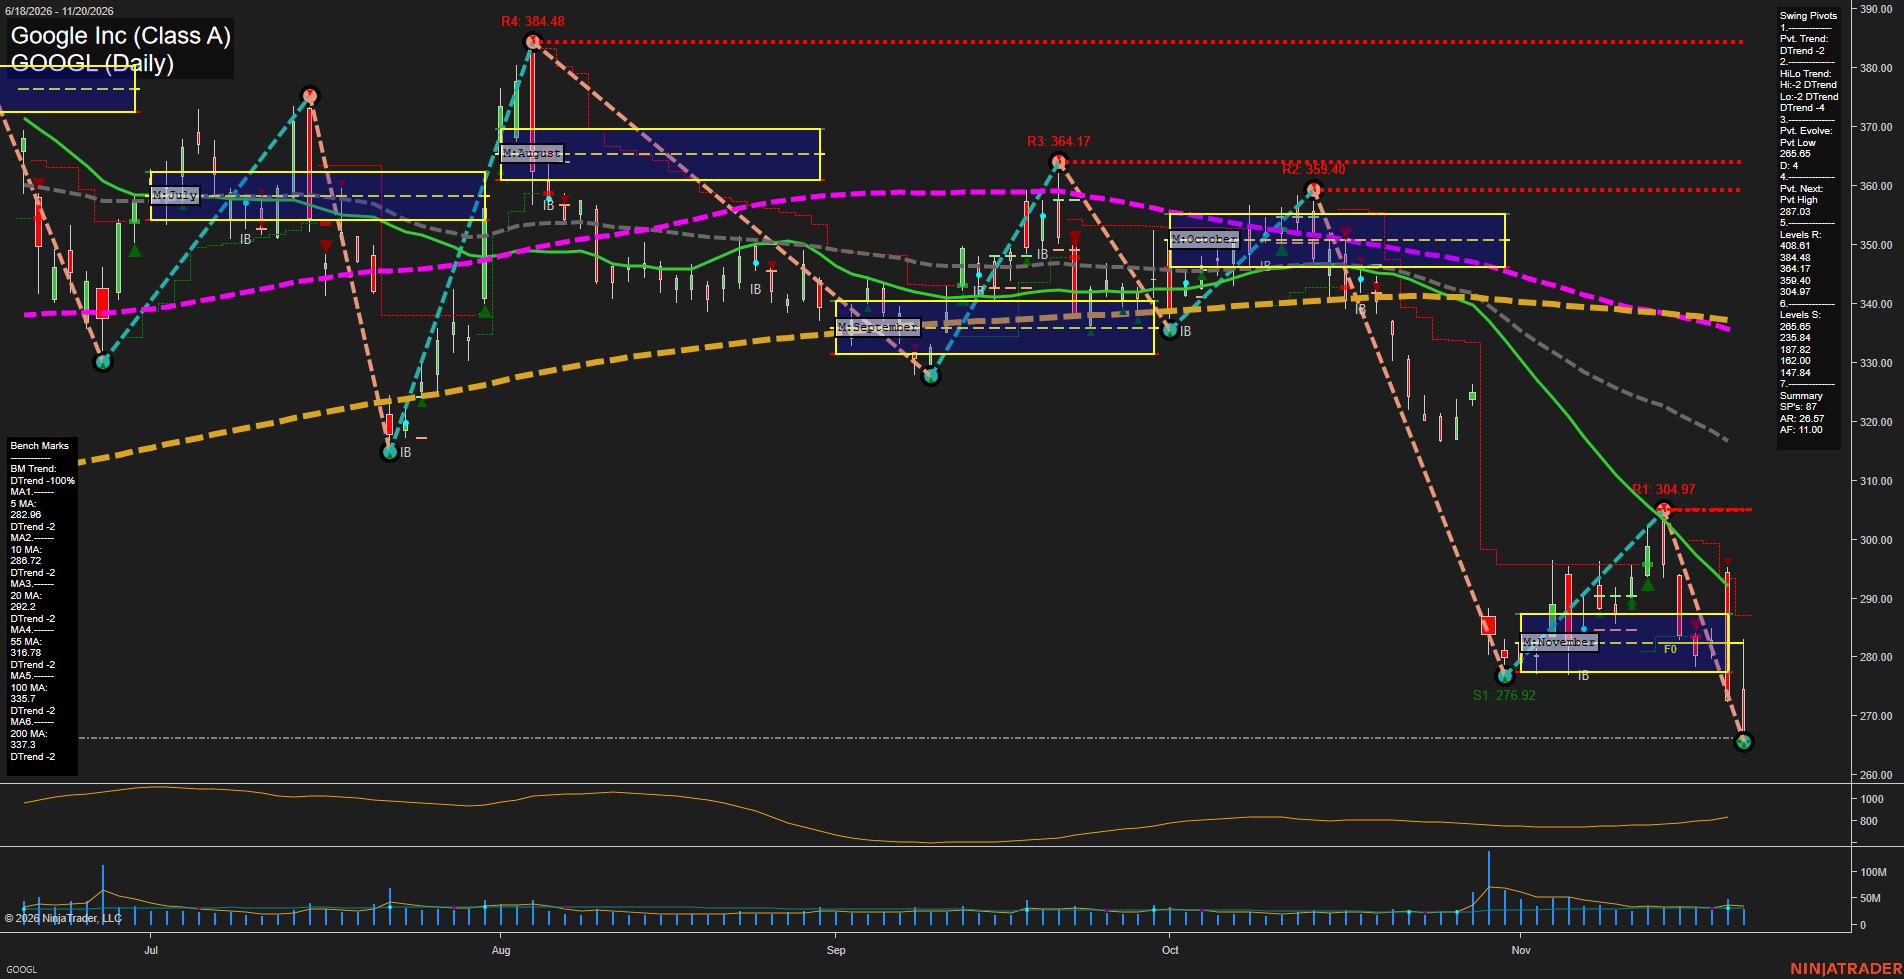
GOOGL Google Inc (Class A) Daily Chart Analysis — After Market Close: 2026-Nov-20 15:07 CT
Price Action
- Last: Approximately 266.30,
- Bars: Large,
- Mom: Momentum fast.
WSFG Weekly
- Near-Term
- WSFG Current: NA%
- F0%/NTZ' Bias: Price Neutral,
- WSFG Trend: Neutral.
MSFG Month Nov
- Medium-Term
- MSFG Current: Below F0% and NTZ
- F0%/NTZ' Bias: Price Bearish,
- MSFG Trend: Bearish.
YSFG Year 2026
- Far-Term
- YSFG Current: NA%
- F0%/NTZ' Bias: Price Neutral,
- YSFG Trend: Neutral.
Swing Pivots
- (Near-Term) 1. Pvt. Trend: DTrend,
- (Medium-Term) 2. HiLo Trend: DTrend,
- 3. Pvt. Evolve: Pvt low 265.65,
- 4. Pvt. Next: Pvt high 287.03,
- 5. Levels R: 408.61, 384.48, 364.17, 359.40, 304.97,
- 6. Levels S: 265.65, 235.84, 187.82, 162.00, 147.84.
Daily Benchmarks
- (Near-Term) 5 Day: 282.98 Down Trend,
- (Near-Term) 10 Day: 286.72 Down Trend,
- (Medium-Term) 20 Day: 292.2 Down Trend,
- (Medium-Term) 55 Day: 316.78 Down Trend,
- (Far-Term) 100 Day: 335.7 Down Trend,
- (Far-Term) 200 Day: 337.3 Down Trend.
Additional Metrics
- ATR: 420,
- VOLMA: 25379774.
Overall Rating
- Near-Term: Bearish,
- Medium-Term: Bearish,
- Far-Term: Bearish.
Key Insights Summary
From a futures swing trader’s perspective, this equity chart shows aligned downside momentum across all six benchmarks and both pivot trends. The rebound from 276.92 to 304.97 proved countertrend; its reversal has produced a fresh lower low near 265.65. Price has broken beneath November’s monthly balance area, approximately 278–287, indicating downside range expansion rather than consolidation. The 287.03 next-pivot threshold marks the chart’s near-term reversal reference, while 304.97 remains the nearest listed pivot resistance. Price is stretched below falling averages, but the chart does not yet establish a durable recovery. Weekly and yearly grids and named trade-signal readings are unavailable; their neutral placeholders are not confirmed neutral signals. ATR and VOLMA are the supplied template values, not independently verified chart readings. No news or seasonal catalyst can be established from the image.
Chart Analysis ATS AI Generated: 2026-11-20 15:07 for Informational use only, not trading advice. Terms and Risk Disclosure Copyright © 2026. Algo Trading Systems LLC.