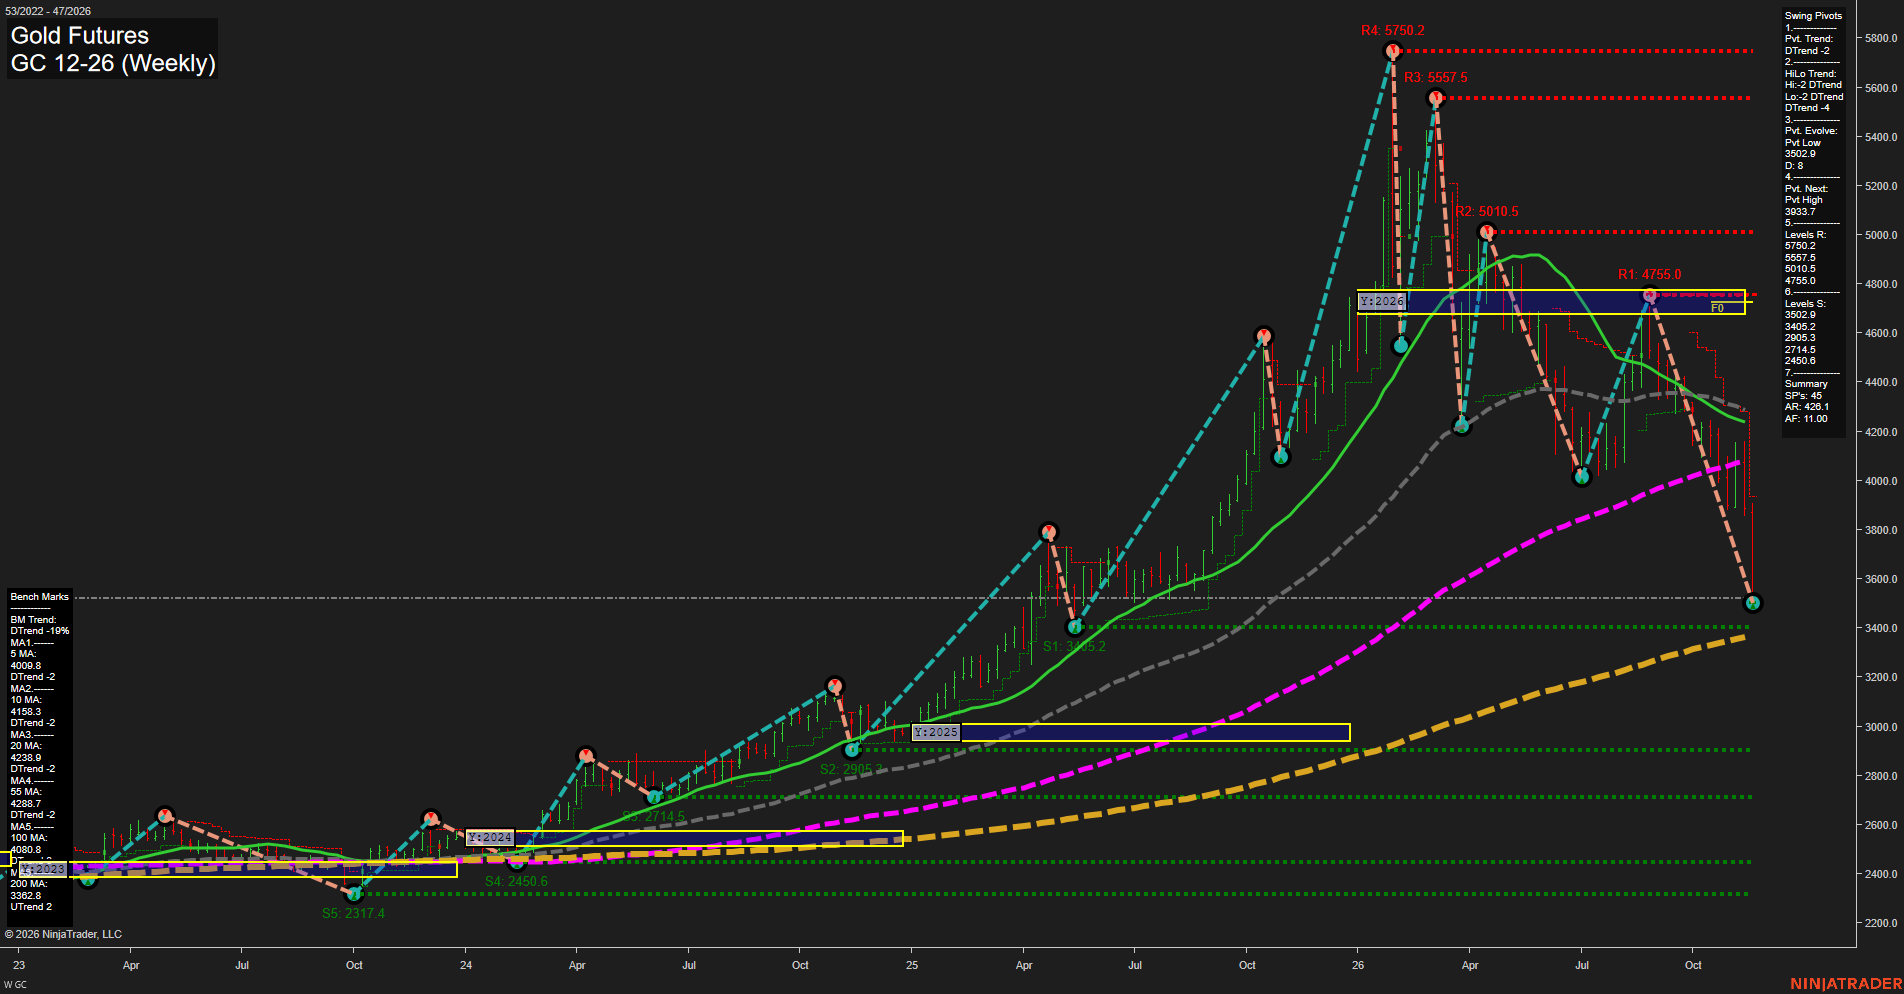
GC Gold Futures Weekly Chart Analysis — After Market Close: 2026-Nov-20 15:06 CT
Price Action
- Last: Approximately 3525.0,
- Bars: Large,
- Mom: Momentum fast.
WSFG Weekly
- Near-Term
- WSFG Current: -144%
- F0%/NTZ' Bias: Price Below,
- WSFG Trend: Down.
MSFG Month Nov
- Medium-Term
- MSFG Current: -91%
- F0%/NTZ' Bias: Price Below,
- MSFG Trend: Down.
YSFG Year 2026
- Far-Term
- YSFG Current: -243%
- F0%/NTZ' Bias: Price Below,
- YSFG Trend: Down.
Swing Pivots
- (Near-Term) 1. Pvt. Trend: DTrend,
- (Medium-Term) 2. HiLo Trend: DTrend,
- 3. Pvt. Evolve: Pvt low 3502.9,
- 4. Pvt. Next: Pvt high 3933.7,
- 5. Levels R: 5750.2, 5557.5, 5010.5, 4755.0,
- 6. Levels S: 3502.9, 3405.2, 2905.3, 2714.5, 2450.6.
Weekly Benchmarks
- (Near-Term) 5 Week: 4009.8 Down Trend,
- (Near-Term) 10 Week: 4158.3 Down Trend,
- (Medium-Term) 20 Week: 4238.9 Down Trend,
- (Medium-Term) 55 Week: 4288.7 Down Trend,
- (Far-Term) 100 Week: 4080.8 Up Trend,
- (Far-Term) 200 Week: 3362.8 Up Trend.
Recent Trade Signals
- 18 Nov 2026: Short GC 12-26 @ 3811.2 Signals.USAR-MSFG
- 18 Nov 2026: Short GC 12-26 @ 3817.3 Signals.USAR-WSFG
- 12 Nov 2026: Short GC 12-26 @ 3883.5 Signals.USAR.TR720
Overall Rating
- Near-Term: Bearish,
- Medium-Term: Bearish,
- Far-Term: Bearish.
Key Insights Summary
From a futures swing-trading perspective, gold is in an accelerating downswing within a broader correction from the 5750.2 peak. Lower swing highs and lower lows confirm deterioration, while the latest large weekly decline extends the rejection from 4755.0 toward the evolving 3502.9 pivot low. Price is below the falling 5-, 10-, 20- and 55-week benchmarks and below the rising 100-week average, confirming that selling extends beyond a routine near-term pullback. Support is concentrated at 3502.9 and 3405.2, followed by the rising 200-week benchmark at 3362.8. The 3933.7 opposite-pivot threshold is the nearest structural reference for a potential recovery, rather than a confirmed reversal. Downward session-grid readings and the supplied short signals reinforce bearish alignment across horizons, although rising 100- and 200-week averages show residual strength in the longer-term trend. News catalysts and seasonal effects cannot be established from this chart alone.
Chart Analysis ATS AI Generated: 2026-11-20 15:07 for Informational use only, not trading advice. Terms and Risk Disclosure Copyright © 2026. Algo Trading Systems LLC.