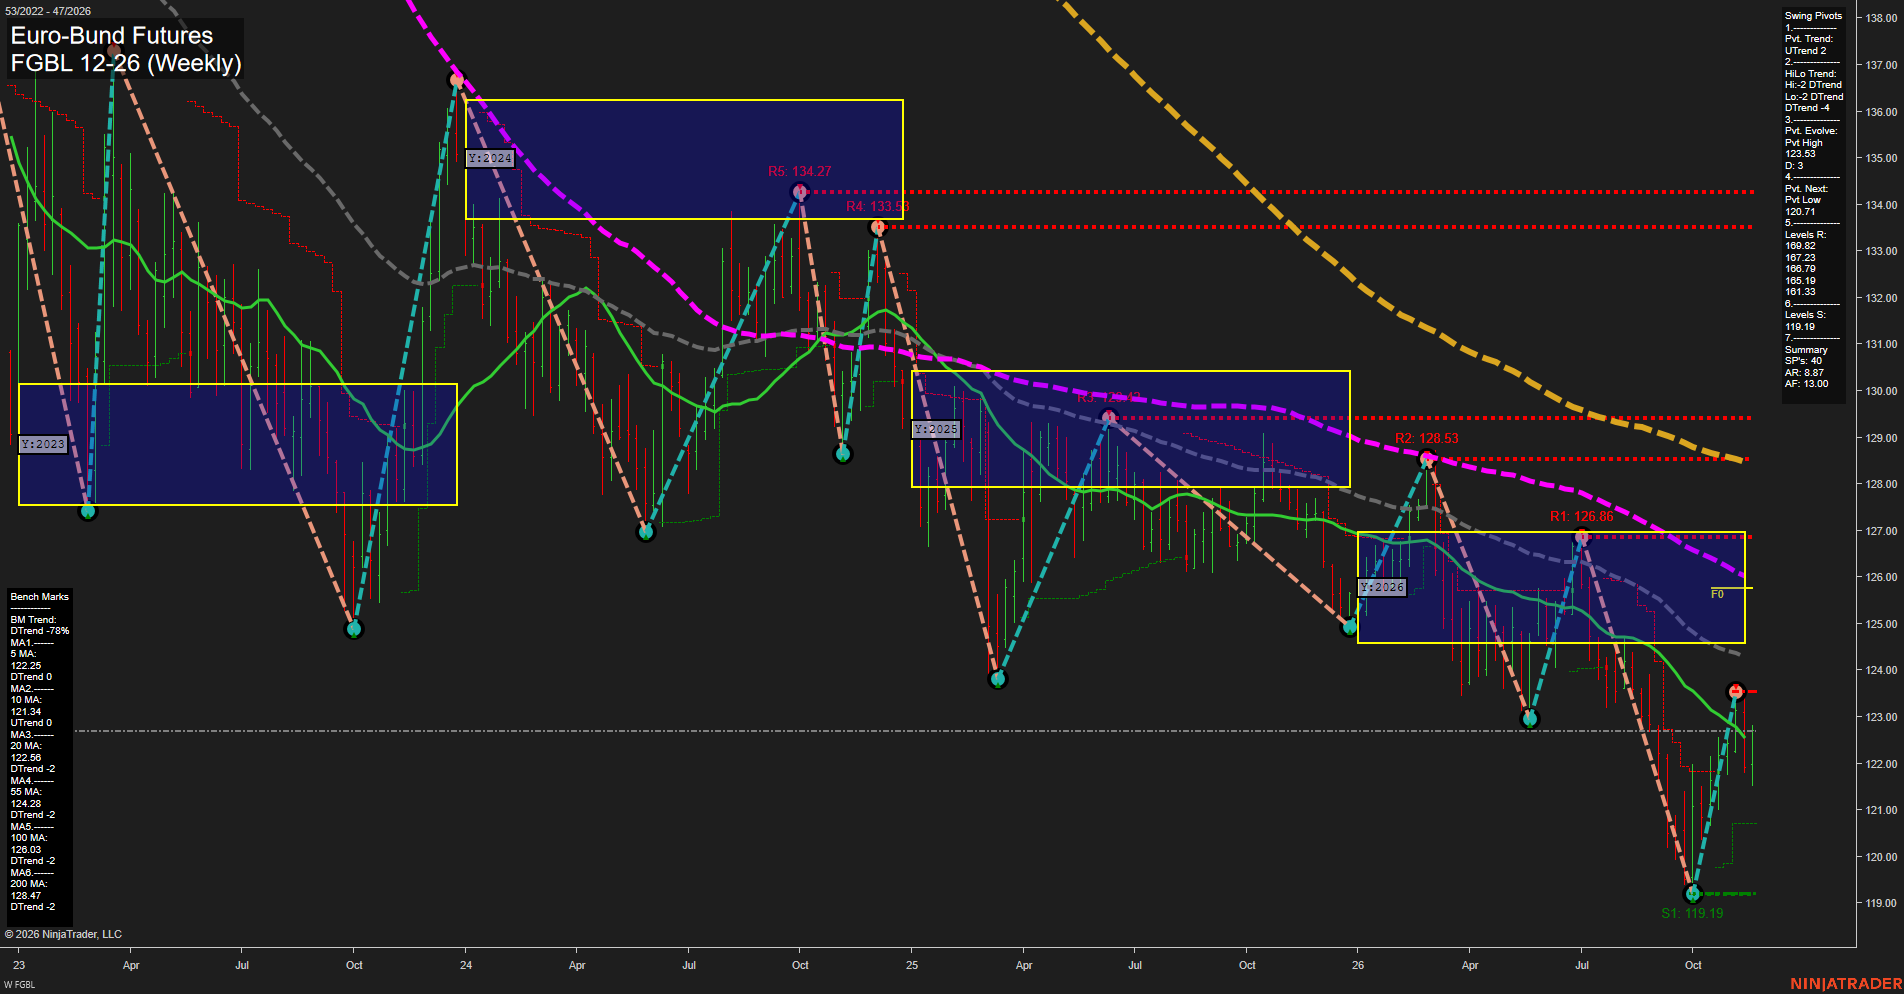
FGBL Euro-Bund Futures Weekly Chart Analysis — After Market Close: 2026-Nov-20 15:06 CT
Price Action
- Last: Approximately 122.70,
- Bars: Large,
- Mom: Momentum average.
WSFG Weekly
- Near-Term
- WSFG Current: 61%
- F0%/NTZ' Bias: Price Above,
- WSFG Trend: Up.
MSFG Month Nov
- Medium-Term
- MSFG Current: 20%
- F0%/NTZ' Bias: Price Above,
- MSFG Trend: Up.
YSFG Year 2026
- Far-Term
- YSFG Current: -26%
- F0%/NTZ' Bias: Price Below,
- YSFG Trend: Down.
Swing Pivots
- (Near-Term) 1. Pvt. Trend: UTrend,
- (Medium-Term) 2. HiLo Trend: DTrend,
- 3. Pvt. Evolve: Pvt high 123.53,
- 4. Pvt. Next: Pvt low 120.71,
- 5. Levels R: 169.82, 167.23, 166.79, 165.19, 161.33,
- 6. Levels S: 119.19.
Weekly Benchmarks
- (Near-Term) 5 Week: 122.25 Down Trend,
- (Near-Term) 10 Week: 121.34 Up Trend,
- (Medium-Term) 20 Week: 122.56 Down Trend,
- (Medium-Term) 55 Week: 124.28 Down Trend,
- (Far-Term) 100 Week: 126.03 Down Trend,
- (Far-Term) 200 Week: 128.47 Down Trend.
Recent Trade Signals
- 20 Nov 2026: Long FGBL 12-26 @ 122.54 Signals.USAR-MSFG
- 20 Nov 2026: Long FGBL 12-26 @ 122.22 Signals.USAR-WSFG
Overall Rating
- Near-Term: Bullish,
- Medium-Term: Bearish,
- Far-Term: Bearish.
Key Insights Summary
The weekly swing picture shows a sharp countertrend recovery from 119.19 toward an evolving pivot high at 123.53, followed by a pullback. Near-term evidence remains bullish through the upward pivot trend, positive weekly grid and recent long signals. Price is approximately above the 5-, 10- and 20-week benchmarks, although only the 10-week average is rising. Medium-term structure remains bearish because both high and low pivot trends and the 20- and 55-week benchmarks point down, despite the improving monthly grid. The declining 100- and 200-week averages and negative yearly grid reinforce the broader downtrend. The chart therefore depicts a rebound within a longer-term sequence of lower highs rather than a confirmed major reversal. Resistance values transcribed from the Swing Pivots summary differ from the plotted resistance labels, which show 134.27, 133.53, 129.42, 128.53 and 126.86. No news or seasonal evidence is supplied.
Chart Analysis ATS AI Generated: 2026-11-20 15:06 for Informational use only, not trading advice. Terms and Risk Disclosure Copyright © 2026. Algo Trading Systems LLC.