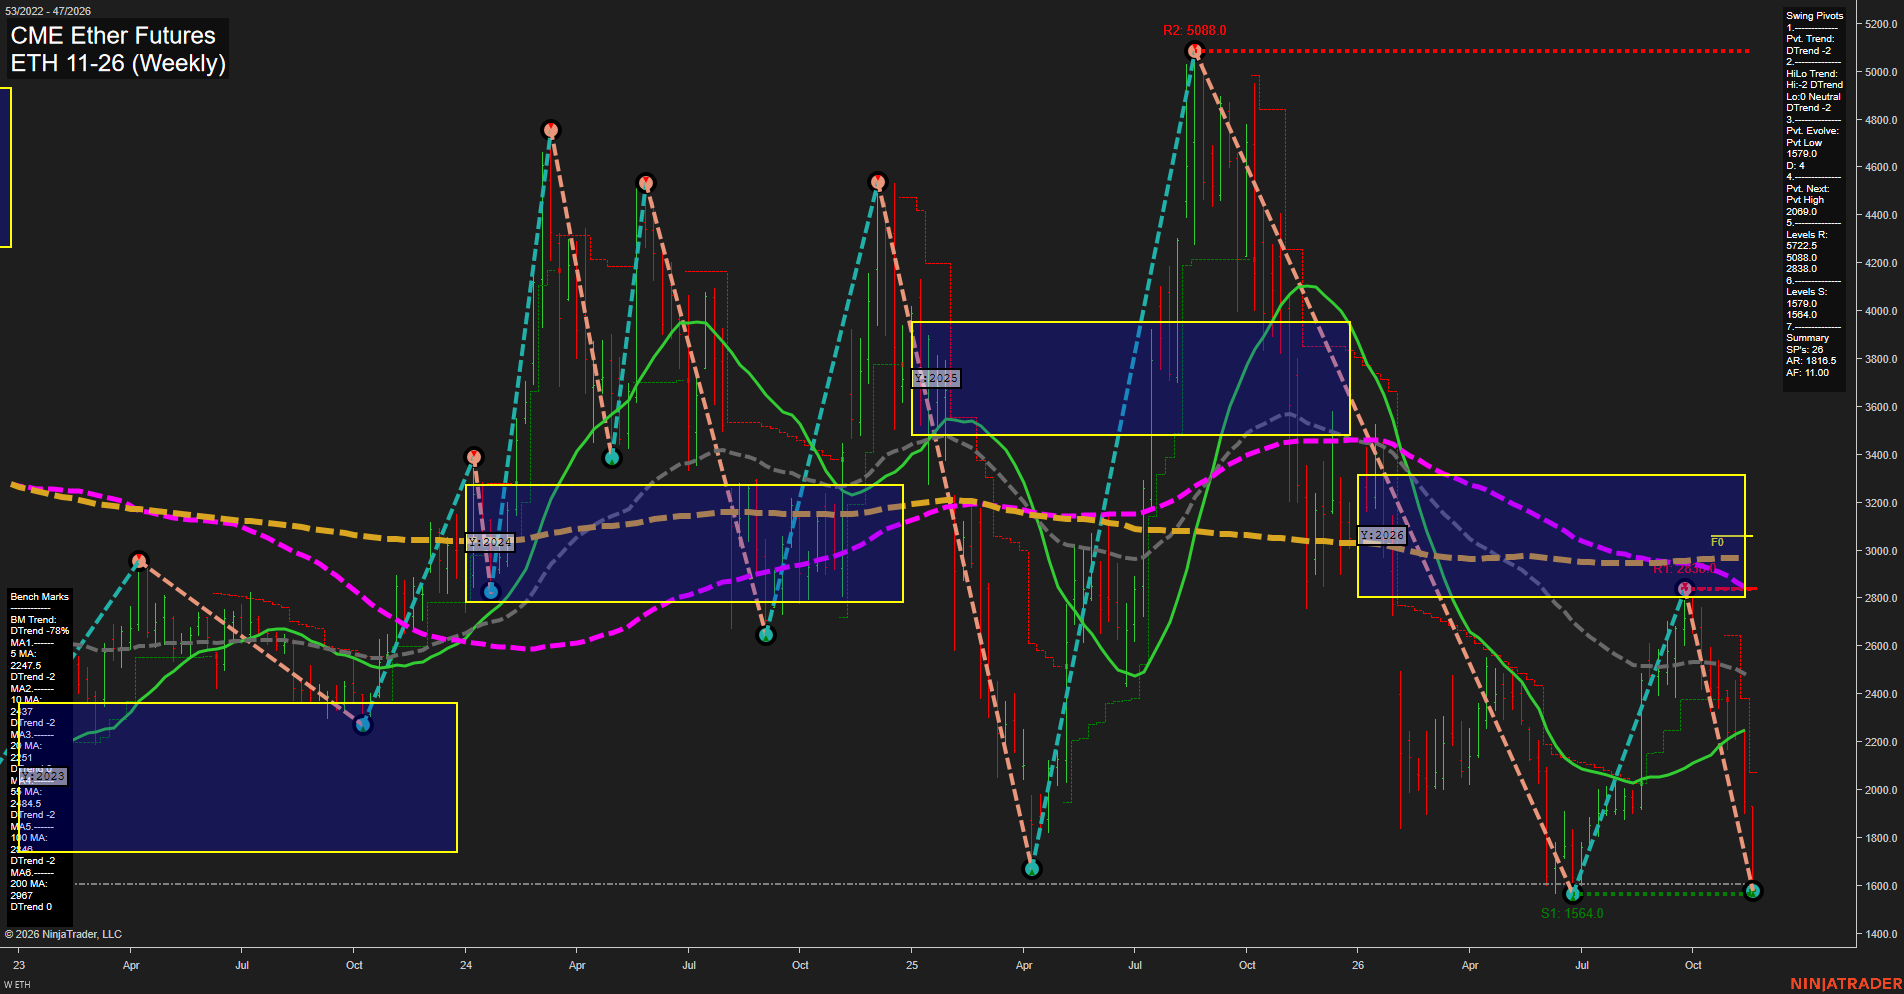
ETH CME Ether Futures Weekly Chart Analysis — After Market Close: 2026-Nov-20 15:05 CT
Price Action
- Last: approximately 1608,
- Bars: Large,
- Mom: Momentum fast.
WSFG Weekly
- Near-Term
- WSFG Current: -77%
- F0%/NTZ' Bias: Price Below,
- WSFG Trend: Down.
MSFG Month Nov
- Medium-Term
- MSFG Current: -110%
- F0%/NTZ' Bias: Price Below,
- MSFG Trend: Down.
YSFG Year 2026
- Far-Term
- YSFG Current: -57%
- F0%/NTZ' Bias: Price Below,
- YSFG Trend: Down.
Swing Pivots
- (Near-Term) 1. Pvt. Trend: DTrend,
- (Medium-Term) 2. HiLo Trend: DTrend,
- 3. Pvt. Evolve: Pvt low 1579.0,
- 4. Pvt. Next: Pvt high 2069.0,
- 5. Levels R: 5722.5, 5088.0, 2838.0,
- 6. Levels S: 1579.0, 1564.0.
Weekly Benchmarks
- (Near-Term) 5 Week: 2247.5 Down Trend,
- (Near-Term) 10 Week: 2437 Down Trend,
- (Medium-Term) 20 Week: 2251 Up Trend,
- (Medium-Term) 55 Week: 2484.5 Down Trend,
- (Far-Term) 100 Week: 2848 Down Trend,
- (Far-Term) 200 Week: 2967 Down Trend.
Recent Trade Signals
- 18 Nov 2026: Short ETH 11-26 @ 1802.5 Signals.USAR-WSFG
Overall Rating
- Near-Term: Bearish,
- Medium-Term: Bearish,
- Far-Term: Bearish.
Key Insights Summary
From a futures swing-trader perspective, the rebound to 2838 has failed, producing a sharp downswing back into the 1579–1564 support cluster. Large weekly ranges and a finish near the lows reflect fast downside momentum rather than an established recovery. The evolving 1579 pivot remains slightly above the prior 1564 low, but both pivot trend measures remain down; this is a support retest, not yet a confirmed double bottom. Price is below all six weekly benchmarks and all three session-grid neutral zones, reinforcing bearish alignment across time horizons. The rising 20-week average is a lagging counterpoint to otherwise weak trend readings. The summary identifies 2069 as the next opposite-pivot reversal threshold, while 2838 remains the nearest listed swing resistance. The supplied weekly short signal aligns with the decline; other signal families, news catalysts, and seasonal effects are not established by this chart.
Chart Analysis ATS AI Generated: 2026-11-20 15:05 for Informational use only, not trading advice. Terms and Risk Disclosure Copyright © 2026. Algo Trading Systems LLC.